

Table of Contents
- The 5 Most Reliable MT5 Trend Following Indicators
- 1. Moving Averages: The Foundation of Trend Following
- 2. MACD: Confirming Momentum and Direction
- 3. Supertrend: Riding Volatility for Clear Signals
- 4. Parabolic SAR: Pinpointing Reversal Points
- 5. Ichimoku Cloud: A Complete Trend Picture
- An MT5 Indicator Installation Guide for Custom Tools
- How to Backtest MT5 Strategies for Reliability
- Frequently Asked Questions
Last Updated: September 7, 2026
Trend following remains one of the most durable trading approaches, yet your tools determine whether you capture a clean move or get chopped up in noise. For MetaTrader 5 traders, the native toolkit already contains several dependable trend following indicators, though knowing which to trust and how to combine them takes practice. This guide breaks down the five most reliable options and shows you how to configure them for real market conditions.
Successful trend following is less about a magic indicator and more about building a system that filters noise while keeping you in the trade during pullbacks. The indicators below have stood the test of time across forex pairs, indices, and other asset classes.
The 5 Most Reliable MT5 Trend Following Indicators
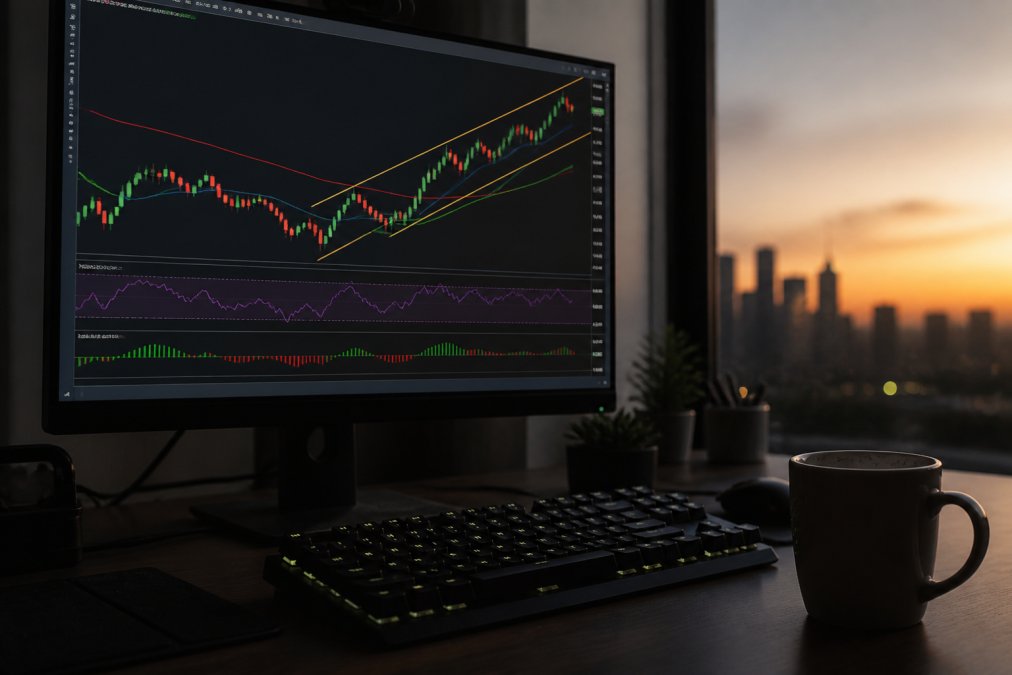
The five most reliable MT5 trend following indicators are Moving Averages, MACD, Supertrend, Parabolic SAR, and Ichimoku Cloud. Each approaches trend identification differently: Moving Averages smooth price to reveal direction, MACD confirms momentum, Supertrend adapts to volatility, Parabolic SAR pinpoints reversals, and Ichimoku Cloud provides a complete visual picture of trend strength and support.
What separates a useful indicator from a distracting one is signal lag. Every trend following indicator is, by definition, a lagging tool: it confirms a move after price has already started. Your goal is to manage that lag, pairing indicators so one confirms what the other suggests, rather than stacking five tools that all say the same thing.
How We Evaluated These Indicators
Each indicator was assessed on reliability across market conditions, signal clarity, ease of use within MT5, and integration into a broader strategy. Built-in MT5 indicators scored higher for accessibility since they require no installation, while custom tools earned points for specialized functionality.
1. Moving Averages: The Foundation of Trend Following
Moving averages are the bedrock of trend following indicators, and every serious trader should master them first. A moving average smooths price data over a set period, giving a clear visual of trend direction: price above signals an uptrend, below signals a downtrend. The exponential moving average (EMA) reacts faster than the simple version, making it the preferred choice for entry timing.
The most common approach is the crossover system. When a fast EMA (e.g., 20-period) crosses above a slower EMA (e.g., 50-period), it generates a buy signal; the reverse signals a sell. This works best on higher timeframes like the 1-hour and 4-hour charts where noise is filtered out. A common mistake is using moving averages on low timeframes during ranging markets, producing whipsaw signals that erode your account through repeated stop losses.
Set your moving averages to 20 and 50 EMA on the 4-hour chart for a balanced approach. The 20-period catches early momentum while the 50-period confirms the broader trend, reducing false signals during pullbacks.
2. MACD: Confirming Momentum and Direction
Moving average convergence divergence, or MACD, is a momentum oscillator showing the relationship between two exponential moving averages of price. It consists of the MACD line, a signal line, and a histogram visualizing the gap between them. When the MACD line crosses above the signal line, momentum is building to the upside; a cross below signals downside pressure.
MACD is not a standalone entry tool. Its real value comes from confirmation: when price makes a higher high and MACD does too, the trend is healthy. When price makes a higher high but MACD makes a lower high, you are looking at bearish divergence, a warning that the trend may be losing steam. This makes MACD an excellent filter for moving average signals, helping you avoid entries right before a reversal.
| Indicator | Primary Signal | Best Timeframe | Key Limitation |
|---|---|---|---|
| Moving Averages | Price vs. average / crossover | 1H and above | Whipsaws in ranging markets |
| MACD | Signal line cross / histogram | 1H and above | Lags in fast reversals |
| Supertrend | Price vs. trailing line | Any, adapts to volatility | Late exits in strong trends |
| Parabolic SAR | Dot flip above/below price | Trending markets only | Fails in sideways chop |
| Ichimoku Cloud | Price vs. cloud / cloud color | 1H and above | Cluttered on low timeframes |
For default settings, the standard 12, 26, 9 parameters work across most instruments. Adjust the histogram to a thicker line style in MT5 properties if you want to read momentum shifts at a glance.
3. Supertrend: Riding Volatility for Clear Signals
The Supertrend indicator plots a single line above or below price based on average true range (ATR), making it one of the clearest volatility-based trend following indicators available. When the line sits below price, the trend is up; when it flips above, the trend has turned down. There are no complex crossovers to interpret, making it ideal for traders who want unambiguous signals.
Supertrend’s adaptability is its main strength. Because it uses ATR, the indicator automatically widens its parameters during high volatility and tightens them during calm periods, performing well across asset classes without constant manual adjustment. The tradeoff is that Supertrend can give back profit during strong trends because it trails price closely, exiting on minor pullbacks that later resolve in your favor.
Do not use Supertrend as your only exit strategy in a powerful trending market. The trailing line will often stop you out on a routine pullback, only for price to resume its move without you. Combine it with a wider stop loss or a moving average filter to stay in the trade longer.
4. Parabolic SAR: Pinpointing Reversal Points
Parabolic SAR (stop and reverse) is a trend following indicator designed to identify where momentum shifts. It places small dots below price during an uptrend and above price during a downtrend. When the dots flip from one side of price to the other, it signals a potential reversal and suggests a position change.
The indicator excels in steady, directional markets where it keeps you on the correct side of the trade. Its limitation becomes obvious in sideways conditions: price oscillates around the dots, generating frequent false flip signals that would stop you out repeatedly. For this reason, Parabolic SAR is best used as a trailing stop mechanism within a confirmed trend rather than as a standalone entry system. The default acceleration factor of 0.02 with a maximum of 0.2 works well for most forex pairs, though you can lower the step to 0.01 for smoother signals on higher timeframes (investopedia.com).
5. Ichimoku Cloud: A Complete Trend Picture
The Ichimoku Kinko Hyo is an all-in-one trend following indicator that delivers support, resistance, and trend direction in a single view. It comprises five lines and a shaded cloud (Kumo) that projects future support and resistance. Price above the cloud confirms an uptrend, below confirms a downtrend, and inside signals a neutral or transitioning market.
What makes Ichimoku powerful is its ability to show trend strength at a glance. A thick cloud indicates strong support or resistance, while a thin cloud suggests a fragile trend that can break easily. The conversion line (Tenkan-sen) and base line (Kijun-sen) function like fast and slow moving averages, generating signals when they cross. For traders who prefer a comprehensive view without stacking multiple indicators, Ichimoku replaces four or five separate tools.
The most reliable MT5 trend following strategy combines two confirming indicators rather than relying on one. A practical setup pairs a 50 EMA for trend direction with the Supertrend for entry timing, filtering out the false signals each produces independently.
An MT5 Indicator Installation Guide for Custom Tools
While built-in indicators require no setup, custom MT5 trend following indicators need proper installation before they appear on your charts. The process takes about five minutes once you know where to place the files. First, download the indicator file, typically with a .mq5 or .ex5 extension, and ensure your MT5 platform is closed. Open your data folder through File, then Open Data Folder in the top menu, and navigate to the MQL5, then Indicators directory. Copy the file into that folder, restart MT5, and the indicator will appear under Insert, Indicators, Custom in the Navigator panel.
A common installation mistake is placing the file in the wrong directory or failing to refresh the Navigator panel. If the indicator does not appear, right-click the Navigator window and select Refresh. Some custom indicators require additional library files (.dll); these must go into the MQL5, Libraries folder instead. Always test a newly installed indicator on a demo chart before applying it to your live trading setup.
Beyond Installation: Optimizing Indicator Parameters to Reduce Lag
Most traders stop at installation, but the real edge comes from code-level optimization. Every trend following indicator has a lag problem, it confirms a move after price has already started. The fix is not finding a zero-lag indicator (it does not exist) but tuning the parameters to match the specific market cycle you trade.
For a custom moving average crossover indicator, the period length directly controls lag. A 200-period EMA on the 1-hour chart will barely move during a pullback, keeping you in a trade but entering late. A 10-period EMA reacts quickly but generates false signals in chop. A practical middle ground for intraday trend following is a 34-period EMA on the 4-hour chart, it filters out most noise while still reacting within a few bars of a genuine reversal.
For Supertrend, the ATR multiplier is the lever that controls sensitivity. The default is often 3.0, which works well on forex majors during normal volatility. Lower it to 2.0 on indices like the S&P 500 (US500) if you want earlier entries, but expect more whipsaws. Raise it to 4.0 on crypto pairs or during high-impact news weeks to avoid being stopped out by volatility spikes. The period setting for ATR also matters: a 14-period ATR is standard, but a 21-period ATR smooths out single-bar volatility anomalies, which helps on lower timeframes like the 15-minute chart.
Editing the Source Code Directly
If you have a .mq5 file (the source code) rather than a compiled .ex5, you can edit parameters directly in the MetaEditor. Right-click the indicator in the Navigator panel, select Modify, and the MetaEditor will open the source. Look for the input section at the top of the file, typically marked with input or sinput keywords. Change the default values there, then click Compile (F7). This is useful when you want to hard-code a specific parameter set for a strategy you run consistently, rather than adjusting inputs every time you attach the indicator.
A more advanced tweak involves the buffer calculation logic. For example, in a custom Supertrend, the indicator calculates ATR on every tick. You can modify the code to use the high and low of the current bar only, which reduces repainting on the current (still-forming) bar. This is a common source of discrepancy between backtest results and live performance. If you see your strategy perform well in the Strategy Tester but poorly live, repainting in the indicator is often the culprit. Look for lines in the code that reference Close[0] or High[0], these are the current, unclosed bar values. Replacing them with Close[1] or High[1] (the previous, closed bar) eliminates repainting entirely.
Editing source code requires a basic understanding of MQL5 syntax. If you are not comfortable with programming, stick to adjusting input parameters through the indicator properties window. A single misplaced semicolon will prevent the indicator from compiling, and you will need to revert to the original file.
A Checklist for Evaluating Any Custom Indicator
Before you commit to a custom indicator, run it through this checklist:
- Does it repaint? Attach it to a chart, wait for a signal, then scroll back. If the signal disappears or moves on historical bars, it repaints and is unreliable for live trading.
- Does it recalculate on closed bars only? Indicators that use the current bar’s close are prone to false signals during the final seconds of a candle.
- What is the drawdown in backtesting? An indicator that shows 80% win rate but a 40% drawdown is not reliable, it likely has a few catastrophic losses that the win rate hides.
- Does it perform consistently across at least three different instruments? An indicator that only works on EURUSD is overfit to that pair’s specific volatility profile.
When you download a custom indicator from a forum or marketplace, check the comments section for user reports on repainting. If multiple users mention signals disappearing, avoid it regardless of how profitable the backtest looks.
By mastering installation and parameter optimization, you turn a generic tool into a system tuned for your market and timeframe. This is the difference between traders who collect indicators and traders who build reliable strategies.
How to Backtest MT5 Strategies for Reliability
Backtesting is the only way to know whether your trend following indicators hold up before risking real capital. MT5’s Strategy Tester allows you to run your strategy against historical data across multiple instruments and timeframes. Open the Strategy Tester panel (Ctrl+R), select your Expert Advisor or indicator, choose a forex pair and timeframe, then set the date range to cover at least two full market cycles, including both trending and ranging periods.
Optimizing your parameters during backtesting requires discipline. Run the test with default settings first to establish a baseline, then adjust one parameter at a time to see how it affects performance. The goal is not to find the perfect settings that fit historical data perfectly, which leads to curve fitting, but to find strong parameters that perform consistently across different market conditions.
Testing Under Specific Market Conditions: The Missing Step
Most backtests fail because traders run a single date range and assume the results apply everywhere. A trend following indicator that crushes it during a strong bull run in 2020-2021 may bleed out during the sideways chop of 2023. To build a reliable system, you must segment your backtest by market regime.
In MT5, you can do this manually by running separate tests on specific date ranges that you know were trending or ranging. For example, on EURUSD, the period from January 2021 to May 2021 was strongly trending upward. The period from June 2022 to September 2022 was choppy and range-bound. Run your strategy on both and compare the results side by side. A reliable indicator should show positive expectancy in the trending period and at least break-even (not catastrophic losses) in the ranging period. If it loses 20% in a two-month ranging phase, it is not reliable, it is a trend-chaser that will eventually wipe out gains.
A more advanced approach uses the built-in custom symbol feature to create a synthetic “trend-only” chart. You can filter historical data to include only bars where price moved more than a certain percentage over a rolling window, then run your test on that filtered data. This isolates how your indicator performs when the trend is clean, without the noise of ranging periods. The drawback is that this does not reflect live conditions, so use it only to understand the upper bound of your strategy’s performance.
Combining Indicators for Confluence: The Backtest That Matters
Single-indicator backtests are useful but incomplete. The real value of trend following emerges when you combine two indicators that filter each other’s false signals. The most practical combination to test is a 50 EMA for trend direction with the Supertrend for entry timing.
Here is the exact logic to test in the Strategy Tester:
- Trend filter: Price must be above the 50 EMA on the 4-hour chart for long trades, below for short trades.
- Entry trigger: Supertrend flips from above to below price (bullish flip) while the trend filter is active.
- Exit: Supertrend flips back above price, or price closes below the 50 EMA, whichever happens first.
Backtest this on three different instruments, for example, EURUSD, GBPUSD, and US500, over a five-year period. What you will typically find is that the combined system reduces the number of trades by 40-60% compared to Supertrend alone, but the win rate and average profit per trade increase significantly. The whipsaw losses from ranging markets are filtered out by the EMA trend requirement.
Interpreting the Results: Metrics That Matter
When the Strategy Tester finishes, do not look at the total profit first. Look at these three metrics in order:
- Profit factor: Gross profit divided by gross loss. A value above 1.5 is generally considered good for a trend following system (cmtassociation.org). Below 1.2, the system is barely surviving on luck.
- Maximum drawdown: The largest peak-to-trough decline in the equity curve. If this exceeds 20% on a demo backtest, the system will be psychologically difficult to trade live, and you will likely abandon it at the worst possible moment (fca.org.uk).
- Number of trades: A system that generates 10 trades in five years is statistically meaningless. You need at least 100 trades to have confidence in the results. If your combined system produces too few trades, lower the timeframe or relax the trend filter.
Beware of the equity curve that looks too smooth. Real trend following systems have long flat periods followed by sharp bursts of profit. If your backtest shows steady, consistent gains every month, check for look-ahead bias, the indicator may be using future data to generate signals. This happens most often with custom indicators that repaint.
The Multi-Timeframe Backtest
A single-timeframe backtest misses the context that multi-timeframe analysis provides. A common pattern is to use the 4-hour chart for trend direction and the 15-minute chart for entries. To backtest this properly, you need to run the Strategy Tester on the 15-minute chart but include a higher-timeframe filter in your Expert Advisor logic.
In MQL5, you can use the iMA function with a higher timeframe parameter to check the 4-hour trend before executing a 15-minute signal. The backtest will run slower because it must calculate both timeframes, but the results will be far more realistic. Most practitioners find that this approach reduces false entries compared to a single-timeframe system, because it aligns your entries with the dominant trend rather than fighting it.
When backtesting, always include a period of high market volatility and a period of low volatility in your date range. An indicator that only works in one condition is not reliable; it is a product of its environment. The COVID-19 crash of March 2020 and the low-volatility summer of 2021 are two extremes worth testing on any forex pair.
By segmenting your backtests by market regime, testing combined indicator logic, and focusing on the metrics that matter, you move beyond generic validation and build a system that you can trust when the market throws its worst at you.
Frequently Asked Questions
What is the most reliable trend indicator for MT5?
There is no single most reliable indicator, as each tool has strengths and weaknesses. Moving averages are excellent for identifying the overall trend direction, while MACD confirms momentum. The most effective approach combines two or three of these 5 reliable MT5 trend following indicators to filter out false signals and improve your entries and exits.
Are free MT5 trend indicators reliable for live trading?
Yes, the built-in indicators like Moving Averages, MACD, and Ichimoku Cloud are free and used by professionals worldwide. Their reliability depends on how you configure and combine them, not their price. Always verify any custom free indicator by learning how to backtest MT5 strategies thoroughly before risking capital.
How do I install a custom trend indicator in MT5?
To install a custom indicator, first download the .mq5 or .ex5 file. Open MT5 and click ‘File’ in the top menu, then select ‘Open Data Folder’. Navigate to the ‘MQL5’ folder and then ‘Indicators’. Copy your file into this folder. Restart MetaTrader 5 or right-click in the Navigator window and select ‘Refresh’ to see your new indicator.
What makes a trend following strategy successful in MT5?
A successful strategy relies on confluence, not a single indicator. Combine a primary tool like the Supertrend to define trend direction with a momentum oscillator like MACD to time your entries. Incorporate a multi-timeframe analysis to confirm the larger trend. The best MT5 trend following strategy also includes disciplined risk management with stop loss and take profit levels.