

Quick Summary
The best mt5 oscillators for trend reversal trading are the RSI, Williams %R, Stochastic, MACD and Awesome Oscillator, which flag when momentum is stretched and fading. An extreme reading signals strain in the trend, not a guaranteed reversal, so confirm with price action before acting.
- Oscillator extremes warn that a trend is under strain but do not guarantee a reversal.
- RSI uses 70 and 30 levels with period 14 as a starting point.
- Williams %R readings near -20 or -80 are the usual extremes; pair it with RSI.
- Wait for a swing break or midline cross to separate a reversal from a pullback.
- Test every indicator and setting on a demo account before trading live.
Table of Contents
- Why Oscillators Matter for Spotting Trend Reversals
- How We Evaluated These MT5 Oscillators
- Quick Comparison: Best MT5 Oscillators at a Glance
- Relative Strength Index (RSI) and Williams %R for Extreme Readings
- Stochastic, MACD, and Awesome Oscillator for Momentum Shifts
- Free Built-In and Third-Party MT5 Options: CCI Woodies, TRIX Arrows, Cronex Impulse, Schaff Trend Cycle
- MT5 Reversal Indicator Settings and Setup Steps
- Divergence Trading Strategies in MT5: Telling Reversals From Pullbacks
- Frequently Asked Questions
Why Oscillators Matter for Spotting Trend Reversals
Oscillators show when price momentum is fading before the trend turns. The most useful MT5 oscillators flag when buying or selling pressure is stretched, the moment a reversal becomes possible.
Oscillators measure the speed or size of recent price moves against a fixed scale.
Watch out: an oscillator stuck at an extreme during a strong trend will keep signaling “overbought” or “oversold” long before any reversal.
How We Evaluated These MT5 Oscillators
We judged each indicator on five points: calculation, repainting, divergence clarity, behaviour across timeframes, and free availability on MT5. Free indicators from Bull Indicators’ MT5 oscillator category were a starting point, along with the MT5 indicator guide from HonorPro and RoboForex’s overview of oscillator types.
Our ranking is an editorial judgment, not a statement of profitability. Published sources lack consistent backtest results, so we do not claim one performs better than another live. Test any indicator on demo data before trading it.
Quick Comparison: Best MT5 Oscillators at a Glance
Here is a summary of the oscillators covered in this guide, with their main use and cost.
| Oscillator | Platform | Cost | Best For |
|---|---|---|---|
| Relative Strength Index (RSI) | MT5 built-in and guide-listed | Free (built in) | Overbought and oversold readings |
| Williams %R | MT5 built-in | Free (built in) | Extreme price readings near range highs and lows |
| Stochastic Oscillator | MT5 built-in | Free (built in) | Momentum turns within a range |
| MACD | MT5 built-in and guide-listed | Free (built in) | Momentum shifts and crossovers |
| Awesome Oscillator | MT5 built-in | Free (built in) | Momentum shifts |
| CCI Woodies | Third-party MT5 | Free download | Momentum with a free download option |
| TRIX Arrows | Third-party MT5 | Free download | Momentum changes |
| Cronex Impulse | Third-party MT5 | Free download | Impulse-style momentum |
| Schaff Trend Cycle | Third-party MT5 | Free download | Trend-cycle analysis |
Built-in indicators are free because they ship with MT5. The third-party downloads were shown as free in the sources we reviewed, but check each vendor’s page before installing.
Relative Strength Index (RSI) and Williams %R for Extreme Readings
The Relative Strength Index measures recent gains against recent losses on a 0-100 scale. Readings above 70 are overbought and below 30 oversold.
Best for: traders who want a widely recognized gauge of overbought and oversold conditions.
Skip if: you trade strong trends and need an indicator that stays quiet until a real reversal forms.
Williams %R scales from 0 to -100 and compares the latest close with the high-low range over a set period. Readings near -20 or -80 are the usual extremes.
Stochastic, MACD, and Awesome Oscillator for Momentum Shifts
The Stochastic Oscillator compares the close with the price range over a chosen period and smooths the result.
MACD tracks two moving averages; its histogram and signal-line crossovers show when momentum is accelerating or fading. The MACD RSI indicator for MT5, listed by Bull Indicators, combines both approaches. The sources we reviewed do not explain the calculation, so confirm the method before relying on it.
Best for: momentum shifts and confirming a trend change.
Skip if: you want signals that arrive early, because MACD is a lagging design.
The Awesome Oscillator measures the difference between a short and long moving average of bar midpoints. Its color changes and “saucer” patterns read momentum shifts.
Best for: confirming momentum shifts with simple visual patterns.
Skip if: you need a fast early warning.
Free Built-In and Third-Party MT5 Options: CCI Woodies, TRIX Arrows, Cronex Impulse, Schaff Trend Cycle
Most MT5 reversal work can be done with built-in oscillators, but several free third-party tools add different signal logic.
| Oscillator | Source | Signal type | Typical settings | Strengths | Limitations |
|---|---|---|---|---|---|
| RSI | MT5 built-in | Level + divergence | Period 14; levels 70/30 | Widely recognized; clear overbought/oversold and divergence | Stays pinned at extremes in strong trends |
| Williams %R | MT5 built-in | Level | Period 14; levels -20/-80 | Fast read of position within recent range | Very reactive; frequent false turns in chop |
| Stochastic | MT5 built-in | Crossover + level | %K 5, %D 3, slowing 3; levels 80/20 | Clear crossover signals inside a range | Many signals on lower timeframes |
| MACD | MT5 built-in | Crossover + histogram | Fast 12, slow 26, signal 9 | Confirms momentum shifts; histogram shows acceleration | Lagging by design |
| Awesome Oscillator | MT5 built-in | Color/saucer patterns | Default 5/34 on bar midpoints | Simple visual momentum-shift patterns | Slow to react versus %R |
| CCI Woodies | Third-party MT5 | Level + zero-line | CCI period 14 (Woodies variants often use 14); levels ±100 | Flags price stretched from its average | Vendor settings vary; confirm calculation |
| TRIX Arrows | Third-party MT5 | Arrow markers on TRIX | TRIX period commonly 15; signal 9 | Visual momentum-change arrows | Arrow logic can repaint; verify on demo |
| Cronex Impulse | Third-party MT5 | Impulse-strength reading | Vendor default; confirm in inputs | Gauges strength of a move | Limited public documentation |
| Schaff Trend Cycle | Third-party MT5 | Cycle + trend turn | Common STC 10/3/3-style inputs; confirm vendor | Combines cycle and momentum to flag turns | Settings vary by build; test before use |
How to read the comparison. Built-in indicators ship with the platform; third-party downloads were shown as free in the sources reviewed, but check the vendor page for current terms. A “free” download still carries installation risk: only install from trusted sources, scan the files, and test on demo before attaching to a live chart.
Practical selection rules.
- For broad recognition and clean divergence reads, start with RSI (period 14, levels 70/30).
- For a fast range-position gauge to pair with RSI, add Williams %R (period 14, levels -20/-80).
- For crossover entries inside a range, use Stochastic (%K 5, %D 3, slowing 3, levels 80/20).
- For confirmation rather than early warning, use MACD (12-26-9) or the Awesome Oscillator (5/34).
- To test alternative logic free, try one third-party tool at a time, CCI Woodies for stretch-from-average, TRIX Arrows for momentum-change markers, Cronex Impulse for impulse strength, or Schaff Trend Cycle for cycle-based turns, and compare against a built-in baseline on the same chart.
Third-party indicators can repaint, and vendor documentation is often thin. Before relying on any of them, confirm the calculation in the inputs, check whether arrows or signals disappear after the bar closes, and run it on demo data for at least a few weeks.
MQL5 Market indicators
MT5 Reversal Indicator Settings and Setup Steps
Setup and settings decide whether an oscillator gives usable reversal signals or noise. The steps below are reproducible in MT5 and pair each indicator with confirmation rules and risk mechanics.
Step-by-step MT5 setup
- Open the chart for your symbol and timeframe (for example, a 1-hour chart for swing reversal work).
- Go to Insert → Indicators → Oscillators and choose a built-in option (RSI, Stochastic, MACD, Awesome Oscillator, Williams %R).
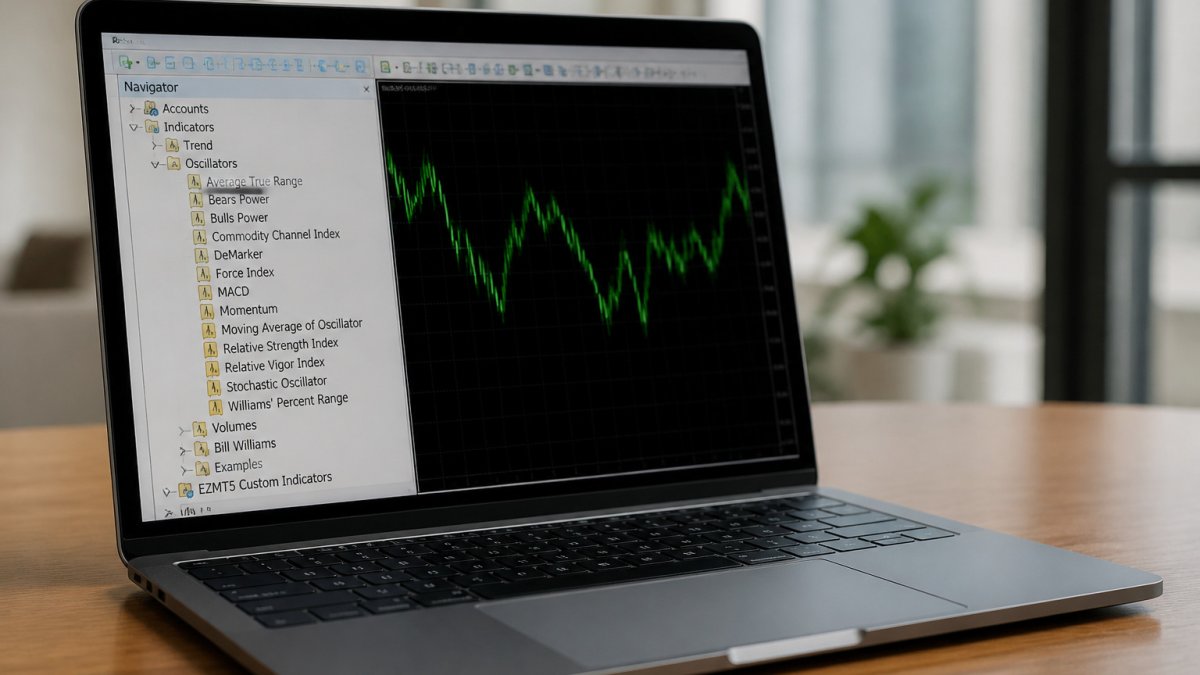
- For a third-party indicator, download the file, copy it to the MQL5\Indicators folder, then restart MT5 or refresh the Navigator.
- Drag the indicator onto the chart and set the inputs below. Save the template (Chart → Template → Save Template) so you can reuse the configuration.
- Add alerts at your overbought/oversold levels (indicator Inputs → Alerts tab) so you do not need to watch the screen.
Reproducible starting settings
| Indicator | Inputs to set | Reversal-relevant levels |
|---|---|---|
| RSI | Period 14; Apply to Close | 70 overbought / 30 oversold; midline 50 |
| Williams %R | Period 14 | -20 overbought / -80 oversold |
| Stochastic | %K 5, %D 3, slowing 3 | 80 overbought / 20 oversold |
| MACD | Fast 12, slow 26, signal 9 | Zero line and signal-line cross |
| Awesome Oscillator | Default 5/34 on bar midpoints | Zero line and color change |
| CCI Woodies | CCI period 14 (confirm vendor) | ±100 and zero line |
| TRIX Arrows | TRIX period 15, signal 9 (confirm vendor) | Arrow markers |
| Schaff Trend Cycle | Confirm vendor inputs (commonly 10/3/3-style) | Cycle turns near 25/75 |
These are starting points, not optimized values. Small period changes shift when signals appear, so test any change on historical data before trading it.
Confirmation rules: reversal vs. pullback
An oscillator extreme alone is not a reversal signal. Use these rules to reduce premature entries:
- Price structure first. Wait for a break of the most recent swing high (bullish reversal) or swing low (bearish reversal) on your timeframe. A pullback usually holds the prior swing; a reversal breaks it.
- Oscillator turn, not just extreme. For RSI, look for a cross back through 50 after an extreme; for Stochastic, a crossover in overbought/oversold territory that then exits it; for MACD, a signal-line cross or histogram flip near the zero line.
- Divergence plus structure. Treat divergence as a warning, then require the swing break before entry. Divergence without a structure break is a pullback candidate.
- Higher-timeframe context. If the higher timeframe is in a strong trend, fade only with the trend or wait for a clear higher-timeframe turn; otherwise the oscillator can stay pinned.
Entry, invalidation, and risk
- Entry trigger: the confirmation close beyond the swing point, not the oscillator extreme.
- Invalidation: place the stop beyond the recent extreme (below the swing low for a long, above the swing high for a short). If price reclaims the extreme, the reversal case is invalid.
- Position sizing: size each position so a single loss is a small, pre-decided share of equity; decide the exit before entering.
- No averaging into losers: divergence can fail repeatedly in strong trends, so do not add to a losing divergence trade.
Settings create the signal; price structure and risk rules create the trade. Test the full sequence, indicator setting, confirmation rule, stop placement, and sizing, on demo data across several symbols and timeframes before committing capital.
Divergence Trading Strategies in MT5: Telling Reversals From Pullbacks
Divergence is one of the most useful ideas for reversal trading.
The hard part is separating a true reversal from a normal pullback, since a pullback often shows divergence too.
Risk management comes first. Place a stop beyond the recent extreme, size each position so one loss is a small share of your account, and decide your exit before entering.
Backtest the rules on your own symbols and timeframes before committing capital; a setup that works on one pair may fail on another.
Frequently Asked Questions
What is the most accurate oscillator for trend reversal?
No oscillator is consistently accurate on its own, and results depend on the market, timeframe and settings. Traders usually get better signals by confirming an extreme reading from one oscillator with a second tool, such as a divergence between price and the oscillator or a clear break in price structure. Test any candidate on your own instrument and timeframe before relying on it, and treat backtests as a starting point rather than proof of future performance.
How do you identify a trend reversal using MT5 indicators?
Start by watching for overbought or oversold readings on an oscillator such as RSI or Stochastic, then look for price making a higher high or lower low while the oscillator fails to confirm it. This divergence is often the first sign of weakening momentum. Wait for price to close beyond a recent swing point before acting, since an extreme reading alone can persist during a strong trend.
Are oscillators better than price action for reversal trading?
Neither approach is reliably better on its own. Oscillators measure momentum and can flag exhaustion early, but they can stay overbought or oversold for long periods in a strong trend. Price action shows where the market actually reacted, such as at support, resistance or a failed breakout. Many traders combine the two, using the oscillator to flag a possible turn and price action to confirm it.
What are the risks of trading trend reversals with oscillators?
The main risk is entering too early, because an oscillator can reach an extreme and keep going. Oscillators also produce false signals in choppy, range-bound markets, and some indicators can repaint or change past values, so check how each one behaves before using it. Define your stop-loss beyond the recent swing, size positions so one wrong call is survivable, and avoid stacking several correlated oscillators that all say the same thing.
