

Table of Contents
- How to Read MT5 Backtesting Reports: The Metrics That Matter
- MT5 Backtest Results Example: A Reproducible Walkthrough
- How to Backtest an EA in MT5: Strategy Tester Settings That Change Results
- MT5 Backtest Accuracy: What Historical Simulations Can and Cannot Tell You
- Practical Pass/Fail Thresholds for MT5 Backtesting Metrics
- Conclusion: From Backtest to Live Trading with Confidence
- Frequently Asked Questions
Last Updated: October 4, 2026
How to Read MT5 Backtesting Reports: The Metrics That Matter
Reading MT5 backtesting performance reports comes down to five numbers: net profit, return, drawdown, profit factor, and trade count. Get those right and you can tell a durable strategy from a lucky one.
MetaTrader 5’s Strategy Tester runs your expert advisor against historical price data and produces a performance report. That report is a simulation, not a promise. Still, it is the fastest way to reject bad ideas before they cost real money.
A backtest tells you how a strategy behaved on past data. It cannot tell you how it will behave next month. Treat it as a filter, not a forecast.
Total Net Profit and Return: The Headline Numbers
Total net profit is all winning trades minus all losing trades, after spread and commission. Return expresses that profit as a percentage of your initial deposit. Both mislead: a large net profit on a tiny deposit looks impressive until you check the trade count, fifty trades over ten years is a coincidence, not a track record.
What we look at instead:
- Net profit relative to the test period, not in isolation
- Return measured against the drawdown it took to get there
- Whether the profit came from many small wins or a handful of lucky trades
A strategy that made its entire profit from two trades is fragile. Remove those two and the edge disappears.
MT5 Backtest Results Example: A Reproducible Walkthrough
Most guides tell you which metrics matter but never show you where each one lives in the actual MT5 report. Picture a EURUSD expert advisor tested over three years on H1 from a $10,000 deposit: net profit $4,200 (42% return), maximum equity drawdown 28%, profit factor 1.4, total trades 380.
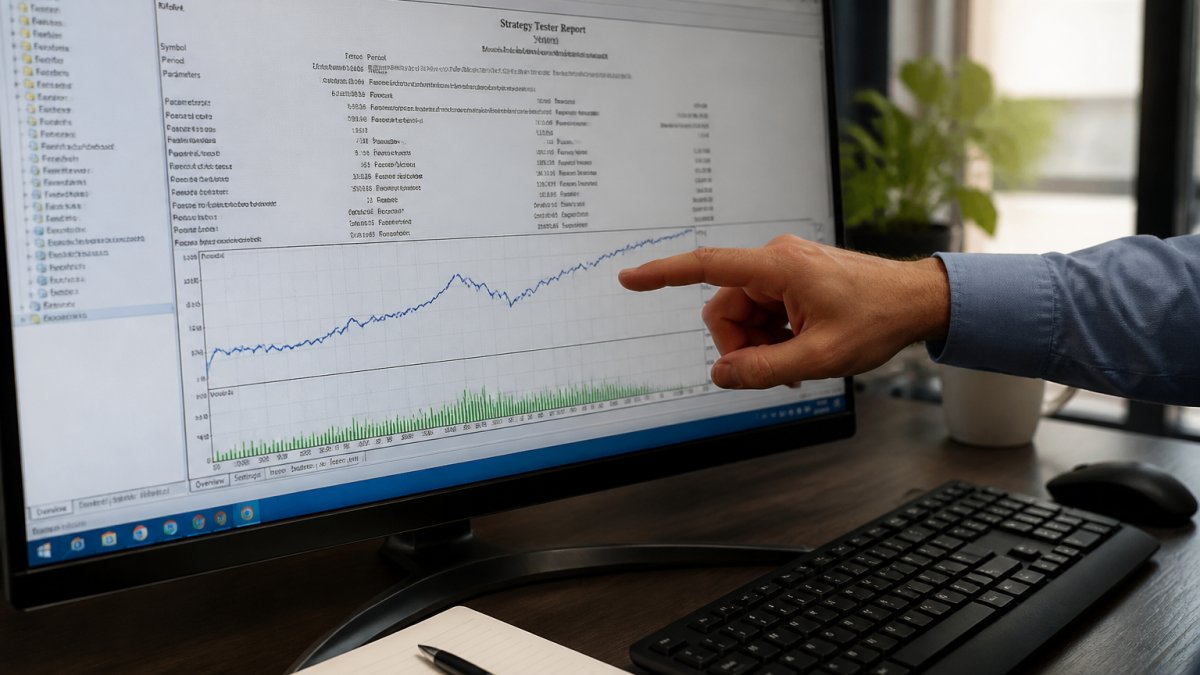
Where Each Field Actually Lives in the MT5 Report
Open the Strategy Tester after a run and you get three tabs: Settings, Results, and Graph.
1. Settings tab, confirm the test before reading any number.
- Symbol and period (top-left of the tester window)
- Modeling mode (Every tick, Every tick based on real ticks, 1 minute OHLC, Open prices only)
- Date range (From / To fields)
- Deposit, leverage, and currency
- Spread setting (Current, or a fixed value you typed in)
If the symbol, date range, or modeling mode are not what you intended, stop. Nothing downstream matters.
2. Results tab, the trade-by-trade table.
Each row is one closed trade, with columns for Time, Deal, Symbol, Type, Volume, Price, S/L, T/P, close time and price, Commission, Swap, and Profit.
3. Summary block at the bottom of the Results tab, the metrics.
Read it in this order:
- Bars, how many bars the test covered. A three-year H1 test is roughly 18,000 bars; far lower means thin history.
- Ticks, total ticks simulated. A low tick-to-bar ratio hints at coarse modeling.
- Total Net Profit, the headline. All wins minus all losses, after commission and swap.
- Gross Profit / Gross Loss, the two halves. If gross profit is $6,000 and gross loss is $1,800, the ratio is your profit factor.
- Profit Factor, Gross Profit ÷ Gross Loss. 1.4 means $1.40 won for every $1.00 lost.
Balance Drawdown vs. Equity Drawdown: The Distinction That Changes the Verdict
MT5 reports drawdown twice, and they are not the same number.
Balance drawdown is measured only on closed trades, the peak-to-trough decline of balance as trades close. Open positions do not count.
Equity drawdown includes floating losses on open positions.
Worked example: you start at $10,000 and open a position that goes $2,500 underwater before recovering to close at +$500.
A report with low balance drawdown and high equity drawdown is a warning sign, not a green light. It means the strategy routinely sits in deep floating losses. Real brokers margin-call on equity.
Reading the Graph Tab
The Graph tab plots balance and equity over time. Two things to look for:
- Divergence between the balance and equity lines. Wide gaps mean large floating exposure, a balance line climbing smoothly while equity sawtooths hides risk in open positions.
- The shape of the curve. A steady slope with shallow dips is an edge; a flat line with one vertical jump is a lottery ticket.
A Reproducible Reading Order
Run this checklist on every report before you form an opinion:
- Settings tab, symbol, period, modeling mode, date range, deposit, spread.
- History Quality, if below 90%, stop and download more history.
- Total Trades, under 100 is thin evidence.
- Total Net Profit and Profit Factor, the headline.
- Expected Payoff, the per-trade edge.
- Equity Drawdown Maximal vs. Balance Drawdown Maximal, the real risk.
- Recovery Factor, profit per dollar of worst drawdown.
- Largest Profit Trade as a share of Net Profit, concentration check.
- Graph tab, balance vs. equity divergence.
How to Backtest an EA in MT5: Strategy Tester Settings That Change Results
Modeling mode decides how tick data is simulated. “Every tick” is the most accurate and slowest; “Open prices only” is fast but can hide intrabar behavior entirely.
Spread should reflect real conditions, a fixed spread of zero makes almost any strategy look profitable.
Deposit and use change position sizing and therefore drawdown. (Source: FINRA’s investor education resources)
Date range should cover more than one market regime; a range with only a strong trend flatters a trend-following system.
Testing with zero spread and no commission is the most common mistake we see. It can turn a losing strategy into a winning one on paper, and the gap shows up the moment you go live.
History Quality and Data Reliability
History quality is the percentage of real tick data available for your test, reported at the bottom of the results tab. Near 100% means genuine historical ticks; a low reading means gaps were filled with generated data, creating trades that never could have happened. Check it first, if quality is poor, download more history and rerun.
MT5 Backtest Accuracy: What Historical Simulations Can and Cannot Tell You
MT5 backtest accuracy depends on three things: data quality, modeling mode, and how honestly you set costs.
A backtest can tell you whether a strategy’s logic produces trades, how it behaves across market conditions, and roughly how much drawdown to expect. It cannot tell you how slippage will affect real fills, whether your broker’s execution matches the simulation, or how the strategy handles a news spike or market gap.
Overfitting, Out-of-Sample Testing, and Forward Testing
Overfitting is when a strategy is tuned so precisely to past data that it captures noise instead of a real edge.
The fix is out-of-sample testing: optimize on the first portion of your data, then test on a portion the strategy has never seen.
Forward testing takes this further, run the strategy on a demo account in real time for several weeks.
Practical Pass/Fail Thresholds for MT5 Backtesting Metrics
Thresholds are useless without the formulas behind them. Before you judge a number, know how MT5 produced it, the same word means different things on different platforms, and a threshold applied to the wrong definition is worse than none.
How MT5 Calculates the Key Statistics
These are the definitions MT5 uses in the Strategy Tester summary block. Other platforms compute some differently, so do not port a threshold across platforms without checking.
- Total Net Profit = Gross Profit − Gross Loss. Includes commission and swap on every closed trade.
- Profit Factor = Gross Profit ÷ Gross Loss (Testing Report – Algorithmic Trading, Trading Robots). A value of 1.0 is breakeven before costs; below 1.0 the strategy lost money over the test.
- Expected Payoff = Total Net Profit ÷ Total Trades. The average dollar result per trade, scaling with trade frequency, a $5 expected payoff on 1,000 trades beats a $50 expected payoff on 20 trades.
- Recovery Factor = Total Net Profit ÷ Maximum Drawdown (in account currency). Dollars of profit earned per dollar of worst peak-to-trough decline.
- Sharpe Ratio = mean trade return ÷ standard deviation of trade returns, scaled by MT5’s internal convention. Higher means smoother returns per unit of volatility.
Because MT5 computes these from the closed-trade ledger, a report with very few trades produces unstable Sharpe, Recovery Factor, and Expected Payoff values. Treat those three on a sub-100-trade sample as indicative, not decisive.
Illustrative Ranges, Not Universal Rules
Use the table below as a first filter. These ranges are starting points, not guarantees, a strategy can be viable while failing one column or unviable while passing all of them.
| Metric | Weak | Acceptable | Strong |
|---|---|---|---|
| Profit factor | Below 1.1 | 1.1 to 1.4 | Above 1.4 |
| Equity drawdown (maximal) | Above 30% | 15% to 30% | Below 15% |
| Total trades | Under 50 | 50 to 100 | Over 100 |
| History quality | Below 90% | 90% to 99% | 99% to 100% |
| Return vs. equity drawdown | Below 1:1 | 1:1 to 2:1 | Above 2:1 |
| Expected payoff | Negative or near zero | Positive but small | Clearly positive and stable across sub-periods |
| Recovery factor | Below 1.0 | 1.0 to 2.0 | Above 2.0 |
How the Metrics Trade Off Against Each Other
The table is a filter, not a scorecard. Real reports rarely land cleanly in one column across every row, what matters is how the metrics interact.
High Sharpe with few trades is noise. On a small sample the distribution of trade returns is unstable, and a high Sharpe is often an artifact of one or two outsized winners.
Recovery factor ties profit to pain. A recovery factor of 3.0 means three dollars earned per dollar of worst drawdown.
Compare return to equity drawdown, not return alone. A 40% return with a 35% equity drawdown is a far worse trade-off than a 25% return with a 10% equity drawdown. The second one you can actually hold through a bad month without a margin call.
A Practical Decision Rule
A strategy that fails two or more columns in the table is not ready for forward testing. One that passes all columns but has fewer than 100 trades deserves a longer test period.
This is where most traders stop reading and start hoping. Do not. The thresholds protect you from your own optimism, and the formulas tell you exactly what you are trusting.
Conclusion: From Backtest to Live Trading with Confidence
Reading an MT5 report well is the difference between a strategy that survives live markets and one that quietly bleeds your account.
At EZMT5, we build our systems with this discipline in mind. Every one of our 11 professional MT5 trading systems is fully built and optimized, so you can start trading right after download.
Ready to trade systems that were built to survive the numbers? Signup Now and start with tools designed for real conditions, not just a pretty backtest.
Frequently Asked Questions
What is a good profit factor in an MT5 backtest?
A profit factor above 1.5 is generally considered good, and above 2.0 is excellent. Profit factor is gross profit divided by gross loss. For example, a profit factor of 1.8 means the strategy earned $1.80 for every $1 lost. However, a high profit factor with very few trades can be misleading. Always check the trade count and drawdown alongside this metric to judge reliability.
How accurate are MetaTrader 5 backtests?
MT5 backtests can be highly accurate when using high-quality historical data and realistic settings. The Strategy Tester’s ‘Every tick’ mode with real spreads and commissions produces results that closely mirror live trading. However, no backtest can predict future performance. Factors like slippage, latency, and changing market conditions can cause live results to differ. Always validate with forward testing on a demo account.
Why can an MT5 backtest look profitable but fail in live trading?
Common reasons include overfitting (tuning parameters to past data), unrealistic test settings (ignoring spread, commission, or slippage), and insufficient trade count. A backtest with only 20 trades may show a high return by chance. Also, market conditions change: a strategy that worked in a trending market may fail in a ranging one. Always use out-of-sample testing and forward testing to check robustness.
How many trades should an MT5 backtest include?
Aim for at least 100 trades to draw meaningful conclusions, though 200 or more is better. Fewer trades increase the risk that results are due to luck. For high-frequency strategies, you might see thousands of trades, which is fine. If your strategy generates fewer than 100 trades over several years, consider testing on a shorter timeframe or additional symbols to build a larger sample.