

Table of Contents
- Opening the MT5 Strategy Tester and Selecting Your Expert Advisor
- Configuring Your MT5 Strategy Tester Settings for Reliable Results
- How Long to Backtest an Expert Advisor for Meaningful Results
- Configuring Realistic Account and Execution Parameters
- MT5 EA Optimization and Avoiding Overfitting
- Running Your Backtest and Interpreting Performance Statistics
- Validating Results: Forward Testing and Out-of-Sample Performance
- Common Backtest Pitfalls and How to Avoid Them
- Frequently Asked Questions
Last Updated: October 10, 2026
Opening the MT5 Strategy Tester and Selecting Your Expert Advisor
Learning how to backtest MT5 expert advisors effectively separates winning strategies from wishful thinking. Most traders skip this step or do it wrong, losing money in live markets. (Source: capturing at least one full market cycle)
Open the Strategy Tester by clicking “View” > “Strategy Tester” in the menu bar.
Select your Expert Advisor from the dropdown menu to backtest MT5 expert advisors. EZMT5 provides fully built and optimized trading systems ready to backtest immediately after download, no coding required.
Verify your data is loaded by checking “Bars modeled” in the results panel. If it’s zero or very low, download history by right-clicking your symbol and selecting “Download history.”
Load your EA and check the “Inputs” tab immediately after selection. This is where you’ll adjust parameters before testing. Reviewing inputs early prevents wasted test runs with wrong settings.
Configuring Your MT5 Strategy Tester Settings for Reliable Results
Choosing Your Symbol and Timeframe
Select the currency pair your EA trades from the “Symbol” dropdown. Match it to what you actually trade.
Test on the timeframe your strategy was designed for. Scalping robots need 5-15 minute data; swing traders need 4-hour or daily.
Setting Date Range and Historical Data
Use at least 2-3 years of historical data to capture bull markets, bear markets, and sideways action.
Set your start date at least 2-3 years in the past and end date to today. Avoid testing only the last few months.
MT5 offers three data sources: real ticks (most accurate but slow), control points (balanced), and open prices (fastest but least realistic). Use control points for regular testing.
Selecting the Modeling Method
Every tick is most realistic but slowest; use for final validation. Control points balances speed and accuracy; use for regular testing. Open prices only is fastest but least realistic; avoid for serious testing. Start with control points, switch to every tick for final validation.
How Long to Backtest an Expert Advisor for Meaningful Results
A minimum backtest spans 2-3 years to capture at least one full market cycle.
For swing trading, use 3-5 years; for day trading or scalping, 1-2 years suffices. The key metric is trade count, not calendar time.
Aim for at least 50-100 completed trades. Fewer trades produce unreliable results; more trades reveal true strategy behavior.
Testing only during bull markets or only during bear markets will fool you. Your backtest must include multiple market regimes. A strategy that works great in trending markets might fail when the market ranges sideways.
Configuring Realistic Account and Execution Parameters
Backtest results are only as trustworthy as your execution assumptions. Many traders use optimistic values, then watch live results diverge sharply from backtests.
Deposit and Leverage
Set your starting deposit to match your actual account size. If you plan to scale later, backtest at the larger size now.
Enter the leverage you’ll actually use, not the maximum available. Higher leverage increases drawdown severity, a 10% market move becomes a 100% account loss at 1:100 leverage.
Spread: The Hidden Cost
Spread is the bid-ask difference and the first cost on every trade. MT5 defaults to zero, which is unrealistic. Research your broker’s typical spread: major pairs 1-3 pips, minor pairs 3-6 pips, exotics 5-15 pips. Enter the average spread during your trading hours, not the best spread during calm periods. A 100-pip profit loses 4 pips to spread (entry and exit); a 20-pip profit loses 20% to spread. This is critical for scalpers.
Commission and Swap Fees
Commission is a flat fee per trade. Enter it in the “Commission” field; a $5 commission on a standard lot equals roughly 0.5 pips. Swap is a fee or credit for holding positions overnight. Check your broker’s swap schedule and use the average rate for your pair. If you hold overnight frequently, swap costs compound significantly.
Slippage and Latency
Slippage is the difference between expected and actual fill price. MT5 assumes perfect execution; real trading doesn’t. For scalping, assume 5-20 pips slippage; for swing trading, 1-5 pips. Account for slippage by adding it to your spread value or using visual mode to observe actual fills.
Broker-Specific Contract Settings
Verify your broker’s contract size and point value. Open your symbol in MT5, right-click, select “Specification,” and check “Contract size” (100,000 for standard forex) and “Point value” (0.0001 for four-decimal pairs). Wrong contract size makes all profit/loss calculations wrong.
Validation: Comparing Backtest Assumptions to Live Broker Data
Before a full backtest, verify your settings: note your broker’s spread, commission, and swap rates, enter them into MT5, run a 1-month backtest, and compare the profit to your manual calculation. If backtest profit is significantly higher, you’ve underestimated costs.
Realistic execution parameters are the difference between a backtest that matches live trading and one that misleads you. Traders often use optimistic spreads, ignore commissions, or assume perfect execution, then wonder why live results disappoint. Spend 10 minutes verifying your broker’s actual costs and entering them into MT5. This single step will make your backtest results far more predictive of real performance.
MT5 EA Optimization and Avoiding Overfitting
Optimization can reveal genuine edge or create the illusion of edge by fitting to historical noise. This section explains how overfitting happens and how to avoid it. (Source: realistic execution assumptions)
How Optimization Works in MT5
Enable optimization by checking the “Optimization” checkbox, setting parameter ranges in the “Inputs” tab (e.g., “Fast MA: 5 to 50 step 5”), and clicking “Start.” MT5 tests every combination and reports the best performer, but this is where overfitting begins.
Understanding Overfitting: The Core Problem
Overfitting occurs when your EA learns historical noise rather than genuine patterns. You optimize on 10 years of data and find that a 23-period fast MA and 67-period slow MA work best. But those specific numbers may have worked only on that exact period due to random patterns that won’t repeat. When you trade live, the EA encounters new patterns and performs poorly. The more parameters you optimize and the wider your ranges, the higher the overfitting risk.
Detecting Overfitting: The Out-of-Sample Test
Test your optimized parameters on unseen data. Split your data: optimize on 2015-2023, test on 2024-2026 without re-optimizing. If out-of-sample results are similar (within 20-30%), your EA has genuine edge. If results are much worse (profit drops 50%+, drawdown spikes), your EA is overfitted. Example: in-sample profit $8,500 vs. out-of-sample $2,100 signals overfitting. Do not trade live.
Walk-Forward Testing: A More Rigorous Validation
Walk-forward testing optimizes and tests repeatedly across your entire data range, mimicking live trading. Divide your data into overlapping windows (e.g., 2-year optimization, 6-month test windows). For each window, optimize and test, then aggregate all out-of-sample results. If walk-forward results match your single in-sample optimization, your EA generalizes well. If much worse, it’s overfitted.
Walk-forward testing is the gold standard for validating trading systems, though computationally expensive. Professional traders and hedge funds use it before deploying any EA.
Practical Tips to Reduce Overfitting Risk
1. Optimize fewer parameters (2-3 key ones). Each parameter multiplies combinations: 3 parameters × 10 values = 1,000 combinations; 5 parameters = 100,000. More combinations = higher overfitting risk. 2. Use wider ranges and larger step sizes (e.g., test 5, 15, 25, 35, 45 instead of every value 5-50). 3. Require at least 50-100 trades in your backtest. 4. Test on longer in-sample periods (5 years better than 1 year). 5. Reserve 20-30% of recent data as a validation set you never optimize on.
Statistical Measures Beyond Profit
Don’t just compare net profit; it can be misleading. Compare: Profit factor (gross profit ÷ gross loss; above 1.5 is good), Sharpe ratio (return per unit of risk; above 1.0 is solid), Maximum drawdown (worst losing streak), Win rate and win/loss ratio (40% win rate with 3:1 ratio is more robust than 60% with 1:1), and Trade count (200 trades more reliable than 20).
If your out-of-sample results are significantly worse than in-sample results, do not trade the EA live. Overfitting is a leading cause of trader losses. Go back and re-optimize with fewer parameters, wider ranges, or longer in-sample periods. Test again. Repeat until your out-of-sample results are comparable to in-sample results.
When Optimization Makes Sense
Optimization is not inherently bad. It’s useful for:
- Finding reasonable parameter values for a new EA (e.g., “What MA periods work best for this strategy?”)
- Adapting an EA to a specific symbol or timeframe (e.g., “This EA works on EURUSD but needs different settings for GBPUSD”)
- Periodic re-optimization in live trading (e.g., optimize every 3 months on the most recent 2 years of data)
But optimization must always be validated on unseen data. If you skip the out-of-sample test, you’re flying blind.
Running Your Backtest and Interpreting Performance Statistics
Click “Start” to run your backtest. MT5 processes your historical data and executes your EA on each bar. Progress appears at the bottom of the screen.
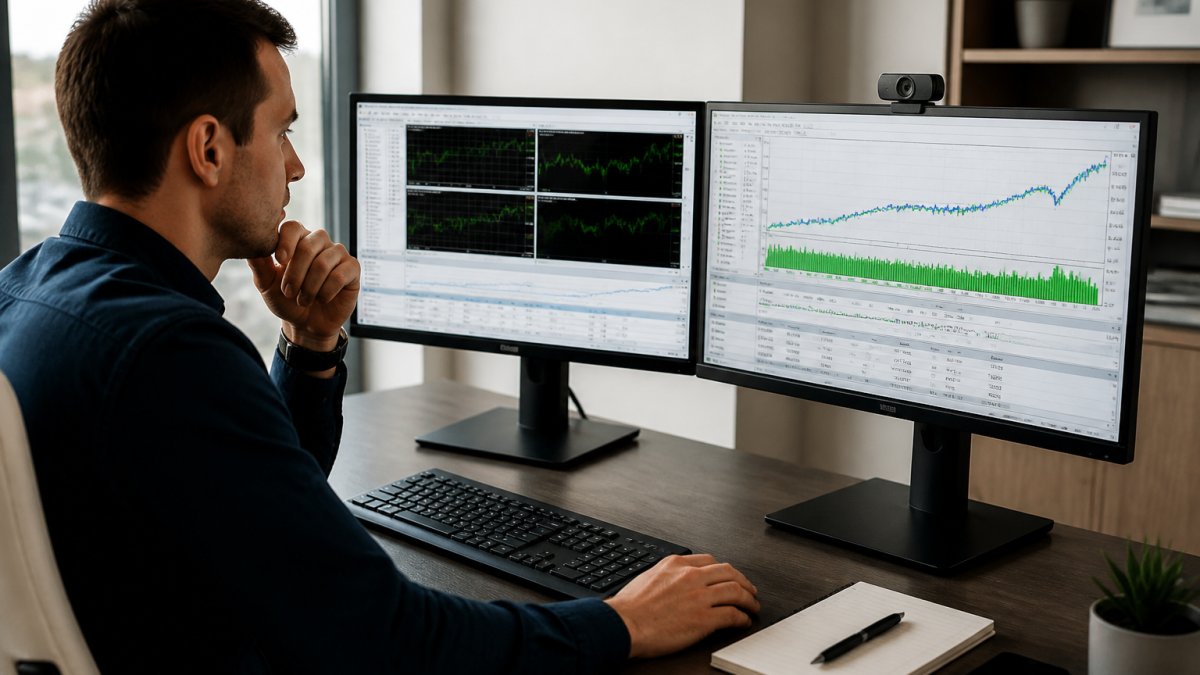
Once complete, the “Results” tab shows your performance statistics. Net profit tells you total gain or loss.
Maximum drawdown shows your worst losing streak in dollar terms. A $5,000 account with a $1,000 maximum drawdown experienced a 20% decline.
Win rate shows the percentage of winning trades.
Expected payoff is average profit per trade. Multiply this by your trade count to estimate total profit.
Validating Results: Forward Testing and Out-of-Sample Performance
Forward testing runs your optimized EA on recent unseen data without re-optimizing, showing whether it adapts to current conditions. Poor forward test results signal overfitting. Re-optimize with fewer parameters and wider ranges; simpler parameters usually forward-test better.
Common Backtest Pitfalls and How to Avoid Them
Insufficient historical data produces unreliable results. Always backtest at least 2-3 years.
Ignoring spreads and commissions inflates backtest profits. Include realistic costs.
Over-optimizing parameters creates systems that fail live. Use fewer parameters and broader ranges.
Testing only favorable conditions hides weaknesses.
Wrong modeling method produces inaccurate results. Use “control points” for regular testing.
Ignoring trade count leads to false confidence. Thirty trades over three years tells you almost nothing.
Backtesting MT5 expert advisors effectively separates traders who validate their systems from those who guess.
Frequently Asked Questions
What’s the difference between backtesting results and live trading performance with an MT5 Expert Advisor?
Backtests use historical price data and assume perfect execution, while live trading encounters real-world variables: market slippage, variable spreads, requotes, and liquidity gaps that don’t exist in historical data. An EA that performs well in backtests can underperform live because market conditions change, and your broker’s execution speed and pricing differ from the test assumptions. This is why forward testing and out-of-sample validation are critical, they reveal whether your EA adapts to new market conditions or only fits historical patterns.
How do I know if my MT5 EA backtest is reliable or just overfitted to past data?
Overfitting occurs when an EA performs exceptionally well on historical data but fails live because it memorized price patterns rather than learning genuine trading logic. Red flags include: parameter optimization that produces unrealistic profit factors above 3.0, profit concentrated in a few trades, maximum drawdown exceeding 40% of account equity, or win rates above 80% with small average wins. Test your EA on out-of-sample data (a separate period it never saw during optimization) and compare results. If performance drops sharply, overfitting is likely. Walk-forward testing, optimizing on one period and testing on the next, also reveals whether your EA adapts to changing markets.
How much historical data do I need to backtest an MT5 Expert Advisor reliably?
Minimum 2-3 years of historical data is standard for currency pairs and indices, though longer is better. Ideally, backtest across at least 100-200 trades to build statistical confidence in results. Shorter timeframes (like 5-minute or 15-minute) generate more trades faster, so 6-12 months may suffice; daily timeframes need 3-5 years minimum. Include at least one full market cycle, bull markets, corrections, and sideways periods, so your EA encounters diverse conditions. Using tick data instead of bar data improves accuracy, especially for EAs that trade multiple times per bar.
Should I use the ‘Every tick’ or ‘Open prices only’ modeling method in MT5 Strategy Tester?
Use ‘Every tick’ (real ticks) for the most realistic backtest, especially if your EA trades frequently or relies on intrabar price movement. ‘Open prices only’ is faster but less accurate because it ignores price action between bar opens, your EA may enter or exit at unrealistic prices. ‘Control points’ is a middle ground: faster than real ticks but more realistic than open prices only. For serious validation, run ‘Every tick’ on real tick data from your broker. If results differ significantly between modeling methods, your EA may be sensitive to execution timing, a red flag for live trading.