

Table of Contents
- Why Entry and Exit Timing Matters in MT5 Trading
- Best Entry and Exit Indicators for MT5
- Using MT5 Trade Management Scripts to Optimize Exits
- Backtesting Strategies in MT5 Strategy Tester
- Price Action and Multi-Timeframe Confluence for Precise Entries
- Automating Entry and Exit Signals with Expert Advisors
- Common Mistakes in Trade Timing and How to Avoid Them
- Conclusion
Last Updated: August 14, 2026
Why Entry and Exit Timing Matters in MT5 Trading
Entry and exit timing determines whether a trade survives or fails. A perfectly timed entry captures the bulk of a strong trend. A premature exit leaves profits on the table; exit too late and reversals erase gains. The difference between a 2% win and a 20% win often comes down to execution precision.
MT5 offers unlimited tools but no built-in guidance on when to pull the trigger. Without a structured framework for entries and exits, you’re trading on instinct. Most traders treat entries and exits as separate decisions, entry gets all the attention, exit gets whatever’s left: a mental note to "take profits around here" or a stop loss placed too tight to survive normal volatility.
This guide walks through the tools, techniques, and automation strategies that separate profitable trading from break-even noise.
Best Entry and Exit Indicators for MT5
The right indicators create confirmation signals. They clarify what the market is doing right now, not predict the future. Three stand out for practical, repeatable use.
Moving Averages and Trend Confirmation
A moving average smooths price action to show the underlying trend direction. When price trades above a long-period moving average, the trend is up. Below it, the trend is down.
The most practical setup uses two moving averages: a faster one (20-period) and a slower one (50-period). When the 20 crosses above the 50, trend momentum is shifting up. When it crosses below, momentum is shifting down. These crossovers make reliable entry signals, especially on 4-hour and daily timeframes.
For exits, as a trade progresses, price often pulls back to the moving average before resuming the trend. If price closes below the moving average on your primary timeframe, that’s a warning signal to tighten stops or reduce position size. A full close below the 50-period MA often signals the trend has broken, time to exit.
Moving averages confirm trends after they’ve started, keeping you out of early reversals. The drawback: you miss the first 5-10% of a move while waiting for confirmation.
Relative Strength Index (RSI) for Overbought/Oversold Conditions
The Relative Strength Index measures momentum by comparing average gains to average losses over a set period (typically 14 periods). RSI above 70 signals overbought conditions; RSI below 30 signals oversold conditions.
For entries, RSI works best in ranging markets. If price is in a downtrend and RSI drops to 25, buying on the bounce can catch a short-term reversal. Use RSI to time entries within the direction of the larger trend, not against it.
For exits, RSI extremes signal when a move is running out of steam. If you’re long and RSI climbs above 80, that’s a signal to take partial profits or tighten your stop loss. Many traders exit when RSI diverges from price, if price makes a new high but RSI doesn’t, the rally is weakening.
Combining RSI with moving average confirmation reduces false signals significantly.
Support and Resistance Levels
Support and resistance are price levels where buying or selling pressure historically clusters. These aren’t magical; they’re simply levels where traders have memory of past trades and set orders.
For entries, the best opportunities come when price approaches support or resistance with confirmation from another indicator. If price approaches a support level and RSI is oversold, that’s a higher-probability entry for a bounce. If price breaks through resistance on high volume with moving averages aligned, that’s a breakout entry.
For exits, support and resistance levels are your profit-taking zones. If you’re long and price approaches a resistance level, that’s where you should consider taking partial profits. If price bounces off support, place your stop loss just below that level.
Identify which support and resistance levels matter by looking for levels where price has bounced or stalled 3+ times, or levels that hold across multiple timeframes.
Using MT5 Trade Management Scripts to Optimize Exits
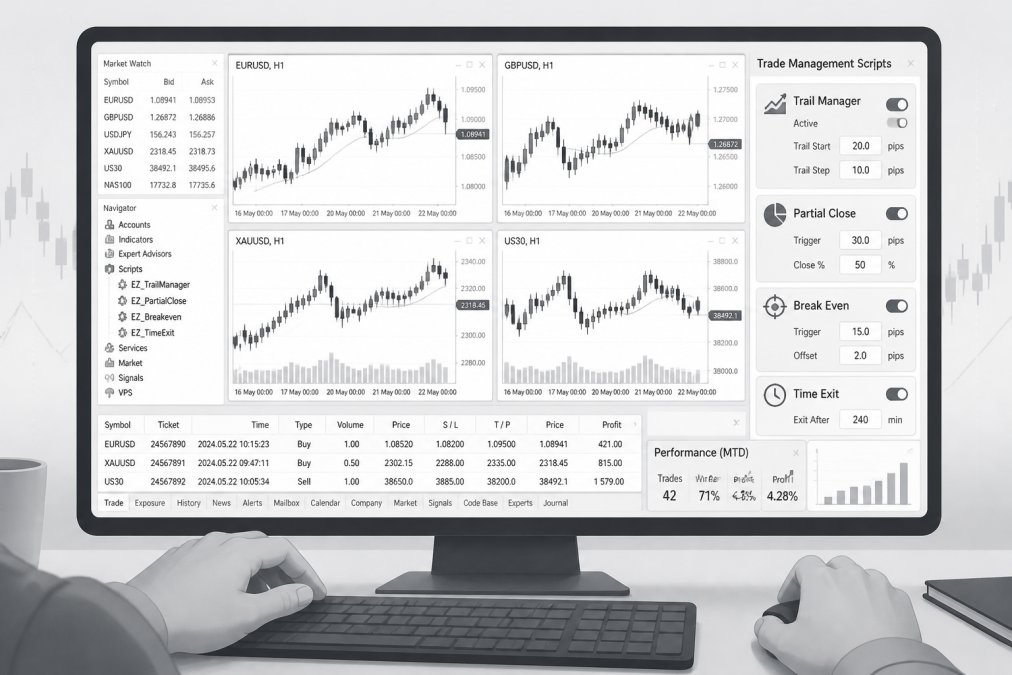
MT5 trade management scripts automate the placement and adjustment of stops and profit targets based on rules you define. This removes emotion and ensures consistent execution.
Automated Stop Loss and Take Profit Placement
The most basic script calculates stop loss and take profit based on the risk-to-reward ratio you specify. You define how many pips you’re willing to risk, and the script places the stop loss that distance away, then calculates the take profit target at a multiple of your risk, commonly 1:2 or 1:3.
A 1:3 risk-to-reward ratio means if you risk 50 pips, you’re targeting 150 pips of profit. This ratio forces you to only take trades where the potential reward justifies the risk. A 1:3 ratio only needs to win 25% of the time to be profitable.
The script places these levels automatically based on entry price. This consistency eliminates a major source of trader error. Some scripts adjust stops dynamically, once price moves a certain distance in your favor, the script moves the stop loss up to lock in profits. Others use ATR (Average True Range) to scale stop loss size based on current volatility.
Trailing Stops and Position Sizing
A trailing stop is a stop loss that moves up with the price in a winning trade, but never moves down. If you’re long and price rises, the trailing stop follows it at a fixed distance. If price reverses and hits the trailing stop, you exit with profits locked in.
Trailing stops let winners run while automatically protecting profits. The challenge is setting the distance right. Too tight, and normal pullbacks trigger exits. Too wide, and you give back too much profit. Most traders use ATR-based trailing stops, where the distance adjusts based on recent volatility.
Position sizing scripts calculate position size based on your account balance and the stop loss distance. If your account is $10,000 and you’re willing to risk 1% per trade ($100), and your stop loss is 50 pips away, the script calculates how many lots to trade. This keeps your risk constant across all trades and prevents overlevering on "sure" trades.
Backtesting Strategies in MT5 Strategy Tester
Backtesting is the only way to know if your entry and exit rules actually work. Testing on historical data reveals whether your logic is sound.
Setting Up Your Backtest Environment
Open the MT5 Strategy Tester by pressing Ctrl+R or navigating to View > Strategy Tester. Select the symbol, timeframe, and date range. Start with at least 2-3 years of historical data to capture different market conditions.
Set the model to "Every tick" for the most accurate simulation. This processes every price tick, not just bar closes. Specify your initial account balance, spread, and slippage. These settings determine how realistic your results are.
Evaluating Trade Results and Exit Efficiency
After a backtest completes, focus on three metrics: win rate, average win vs. average loss, and drawdown.
Win rate is the percentage of trades that make money. A 50% win rate with a 1:2 risk-to-reward ratio is profitable. A 40% win rate with a 1:3 ratio is profitable.
Average win vs. average loss shows the quality of your exits. If your average win is 30 pips but your average loss is 40 pips, your exit discipline is weak. Ideally, your average win should be at least 1.5x your average loss.
Drawdown is the largest peak-to-trough decline in your account during the backtest. High drawdowns (30%+) mean your strategy concentrates risk. Exit efficiency is the percentage of each move you captured. Most traders should target 40-70% efficiency.
Price Action and Multi-Timeframe Confluence for Precise Entries
Price action is the movement of price itself, independent of indicators. A candlestick that closes at the high shows strength. A candlestick that opens at the high and closes at the low shows rejection.
Multi-timeframe confluence means using multiple timeframes to confirm an entry. If the daily chart shows an uptrend and the 4-hour chart shows an entry signal at support, both timeframes align. This dramatically improves entry quality.
Identify the trend on the daily chart. Then, on the 4-hour chart, wait for price to pull back to support or a moving average. When price bounces on the 4-hour, that’s your entry signal. The daily trend gives you direction; the 4-hour gives you timing.
For exits, if price reaches a resistance level that aligns across both timeframes, take partial profits. If price breaks below support on the 4-hour while the daily trend is still up, that’s a stop loss trigger.
Automating Entry and Exit Signals with Expert Advisors
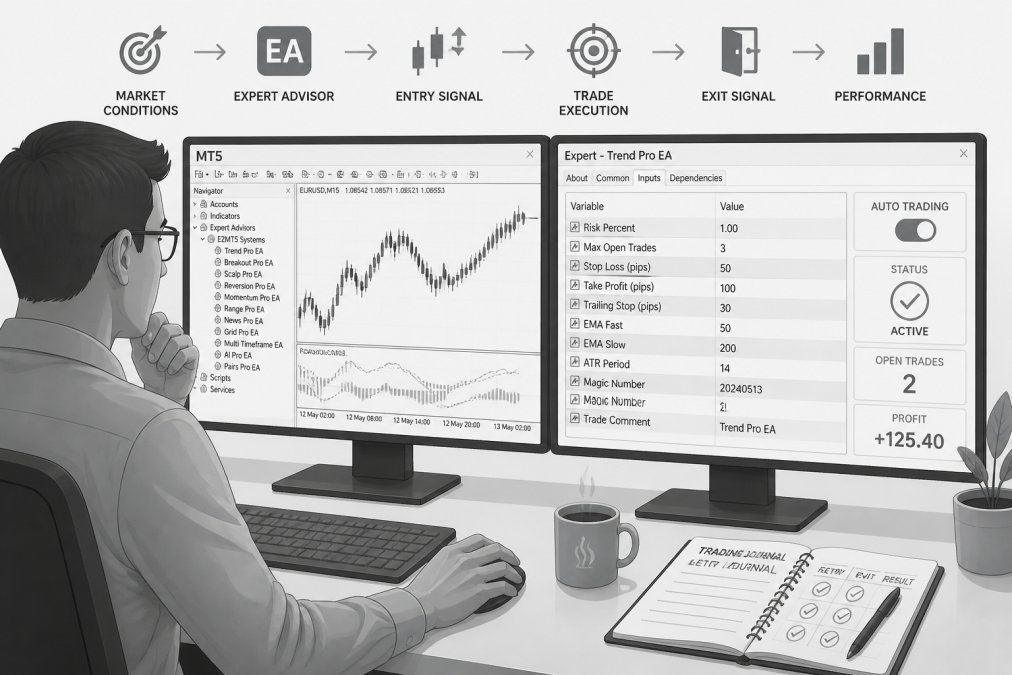
An Expert Advisor (EA) is an automated trading program in MT5 that executes trades based on rules you define. Instead of watching charts and clicking buttons, the EA monitors prices 24/7 and executes trades when conditions are met.
Configuring Expert Advisors for Consistent Execution
Building an EA requires coding in MQL5, but you don’t need to write one from scratch. EZMT5 provides fully built and optimized MT5 Trading Systems that are ready to download and run. These systems come with entry and exit logic already programmed, tested, and optimized.
To use an EA, download it to your MT5 folder (File > Open Data Folder > MQL5 > Experts), restart MT5, and drag the EA onto a chart. A settings dialog appears where you adjust parameters. Enable "Allow automated trading" in MT5 settings, and the EA begins trading automatically.
An EA never hesitates, never overrides its rules, and never exits early because of fear. It trades the exact same logic consistently. The drawback is that an EA only executes what you program. If your logic is flawed, the EA will trade flawed logic at scale. Backtesting before live trading is non-negotiable.
Avoiding Psychological Triggers and Premature Exits
The biggest reason traders fail with EAs is overriding them. A trade opens and immediately goes against you. The emotional response is panic, close the trade, take the loss. But if the EA’s logic is sound and the stop loss is properly placed, that drawdown is normal.
The solution is to trust the backtest. If your backtest shows that your EA wins 55% of trades with a 1:2 ratio over 2 years, then a losing streak of 5 trades in a row is statistically normal. Closing trades early violates the logic that made the backtest profitable.
Set the EA on a symbol and timeframe, then step away. Check results weekly, not hourly. If results are poor after 2-3 months of live trading, analyze the backtest again. But don’t abandon it after 2 weeks of losses.
EZMT5’s approach is to provide multiple systems and indicators so you can diversify. If one system underperforms temporarily, others may outperform. This portfolio approach reduces the psychological pressure to override any single system.
Common Mistakes in Trade Timing and How to Avoid Them
Entering on hunches instead of signals. You see a chart pattern that "looks like" a reversal and enter before your indicator confirms it. The fix: wait for your indicator to confirm. If your entry rule requires RSI below 30 and a moving average bounce, wait for both.
Exiting on noise instead of structure. Price pulls back 20 pips and you exit, thinking the move is over. Then it resumes and moves 100 pips without you. The fix: define your exit before entering and stick to it.
Using stops that are too tight. You place a stop 10 pips away to minimize losses, but normal volatility causes the trade to hit the stop, then the price resumes in your direction. The fix: size your stop based on recent volatility (use ATR) or the support/resistance level.
Not adjusting for market conditions. Your system works great in trending markets but gets whipsawed in ranges. The fix: monitor the market regime. In ranges, use support and resistance entries. In trends, use moving average entries.
Revenge trading after losses. You lose two trades in a row and immediately take a larger position to "get even." The fix: position size is fixed. Every trade risks the same percentage of your account.
The gap between profitable traders and struggling ones rarely comes down to finding the "right" indicator. It comes down to discipline: entering only when your rules are met, exiting only when your rules are met, and sticking to position sizing regardless of emotion.
Improving entries and exits in MT5 becomes automatic when you use the tools available: moving averages for trend, RSI for momentum, support and resistance for levels, trade management scripts for consistent stops and profit targets, and Expert Advisors for execution without emotion. Backtest your approach, trust the results, and execute the plan.
EZMT5 provides fully built systems and indicators to implement this framework immediately. Download a system, configure it with your risk parameters, and let it trade the rules you’ve tested. Start trading like a pro right after download, with real-time trade opportunities and precision execution built in.
| Component | Purpose | Best Use |
|---|---|---|
| Moving Averages | Trend confirmation | Entries aligned with trend direction |
| RSI | Momentum and exhaustion | Timing entries within trends, exiting overbought/oversold |
| Support/Resistance | Entry and exit zones | Placing stops and taking profits at structural levels |
| Trade Management Scripts | Consistent stops and targets | Automating position sizing and risk ratios |
| Trailing Stops | Profit protection | Letting winners run while protecting gains |
| Backtesting | Validation of logic | Confirming entry/exit rules work on historical data |
| Expert Advisors | Automated execution | Trading 24/7 without emotion or manual intervention |
Frequently Asked Questions
Which indicators are most reliable for MT5 entry and exit signals?
The most reliable indicators combine multiple signals: moving averages for trend direction, RSI for overbought/oversold conditions, and support/resistance levels for price action confirmation. No single indicator works alone. Backtesting in MT5 Strategy Tester shows that entries using two or three confirming indicators produce fewer false signals than relying on one. Many successful traders use multi-timeframe analysis, checking a higher timeframe trend before entering on a lower timeframe, to filter out whipsaw trades.
How do I backtest my entry and exit strategies using the MT5 Strategy Tester?
Open MT5 Strategy Tester (View > Strategy Tester), select your Expert Advisor or indicator, set your date range and timeframe, then run the backtest. Review the results report for profitability, drawdown, and exit efficiency metrics. Pay attention to how many trades hit take profit versus stop loss. If your exit efficiency is low, your take profit levels are too tight or your stop loss is too wide. Adjust and re-test until results improve consistently across different market conditions.
What's the difference between a trend-following entry and a mean-reversion exit in MT5?
Trend-following entries occur when price breaks above resistance or a moving average, signaling upward momentum. Mean-reversion exits trigger when price pulls back to a support level or overbought RSI levels normalize, suggesting the trend pause is ending. In MT5, you can code Expert Advisors that enter on trend breakouts but exit on mean-reversion signals, combining both strategies. This approach often produces better risk-to-reward ratios than exiting purely on profit targets.
How can MT5 trade management scripts improve my exit strategy?
Trade management scripts automate stop loss placement, trailing stops, and take profit adjustments based on volatility or price action. Instead of manually monitoring positions, scripts can move your stop to breakeven after a certain profit level, or trail behind price to capture extended moves. This removes emotional decision-making and ensures consistent position sizing and risk control across all trades. Testing these scripts in Strategy Tester shows measurable improvements in exit efficiency and overall profitability.
This article was written using GrandRanker