
Table of Contents
- What Makes a Trading Indicator Profitable
- How to Backtest Trading Strategies for Real Results
- Trading Indicator Win Rate Calculation and Statistical Significance
- How to Avoid Indicator Overfitting in Your Testing
- Best Technical Indicators for Day Trading and Swing Trading
- Combining Multiple Indicators for Profitable Entry and Exit Signals
- Conclusion: From Testing to Live Trading
Identify Profitable Trading Indicators: A Practical Framework
Last Updated: August 3, 2026
Understanding how to identify profitable trading strategy indicators separates traders who consistently generate returns from those who chase every signal. At EZMT5, we empower serious traders with instant, unlimited access to 11 professional, fully built, and optimized MT5 Trading Systems and TradingView indicators, plus all future systems, enabling immediate and precise automated trading with improved entries and exits. Our service delivers real-time trade opportunities and professional-grade tools, allowing users to start trading like a pro right after download.
This guide walks you through a practical framework for identifying which technical indicators genuinely drive profitability. You’ll learn how to test indicators rigorously, avoid psychological traps, and combine multiple signals for genuine edge.
What Makes a Trading Indicator Profitable
A profitable trading indicator identifies market conditions where your edge exists. Most traders confuse a signal with an edge. An indicator that generates a signal every hour isn’t profitable, it’s just active. A profitable indicator generates fewer signals, but the ones it does generate have a statistical advantage.
The core distinction: does the indicator identify situations where price movement favors your side of the trade more often than random chance would predict?
Before testing any indicator, define your win rate threshold. Most professional traders target at least 52-55% win rate on entry signals alone. Below that, the risk-reward ratio needs to be exceptional to generate positive returns.
Lagging vs. Leading Indicators: The Profitability Trap
Leading indicators attempt to predict future price movement. Lagging indicators confirm what has already happened. Leading indicators often generate false signals because they’re trying to predict something inherently unpredictable.
A moving average is a lagging indicator. It tells you where price has been, not where it’s going. By the time a moving average crosses, the move has often already started. But this is why moving averages work consistently across different market conditions.
The biggest mistake traders make is combining too many leading indicators and expecting profitability. A system with five leading indicators all trying to predict the future will generate conflicting signals and higher drawdowns.
Signal Confirmation and Market Sentiment
Profitable indicators rarely work in isolation. The real edge comes from signal confirmation, multiple indicators aligning to suggest the same directional bias. A trend indicator might signal upward movement. A momentum indicator might confirm that buying pressure is increasing. A volume indicator might show that the move is backed by real trading activity.
How to Backtest Trading Strategies for Real Results
Backtesting is where theory meets reality. The critical principle: backtesting must simulate real trading conditions, not ideal conditions. This means accounting for slippage, commissions, and spread widening during volatile periods.
Setting Up Your Backtest Parameters
Define your timeframe first. Are you day trading (5-minute to hourly charts), swing trading (4-hour to daily charts), or position trading (weekly charts)? The timeframe shapes everything.
Next, define your sample size. A profitable strategy tested on 50 trades might be lucky. Tested on 500 trades, it’s more credible. Tested on 2,000 trades across different market conditions, you’re seeing real edge.
Set your slippage assumption. On a liquid asset during normal hours, slippage might be 1-2 ticks. During volatile periods, it could be 5-10 ticks. Be honest about this, optimistic slippage assumptions are the #1 reason backtests look better than live trading.
Define your commission structure. If you’re trading futures, commissions are typically $5-15 per contract. If you’re trading forex, you’re paying the spread. These costs add up quickly when you’re taking 20+ trades per month.
Analyzing Drawdown and Risk-Reward Ratios
Profitability isn’t just about win rate. It’s about the relationship between your winners and losers. A strategy with a 60% win rate but small winners and large losers will lose money. A strategy with a 45% win rate but large winners and small losers will be profitable.
This is measured by the risk-reward ratio. If you risk $100 to make $200, your risk-reward is 1:2. Most professional traders target at least 1:1.5 or better. A strategy with a 50% win rate and 1:2 risk-reward will be profitable over time.
Drawdown is the peak-to-trough decline during a losing streak. Most traders can tolerate 20-30% drawdowns. Above that, most traders quit. This is why maximum drawdown is a critical metric.
Trading Indicator Win Rate Calculation and Statistical Significance
Win rate is the percentage of trades that close profitably. If you take 100 trades and 55 close profitably, your win rate is 55%. But is that 55% real, or is it luck?
Statistical significance tells you whether your results are likely to repeat. A strategy with a 55% win rate on 100 trades might be random. The same strategy on 1,000 trades is probably real. You generally need at least 300-400 trades for a 55% win rate to be statistically significant.
Beyond Win Rate: Profitability Metrics That Matter
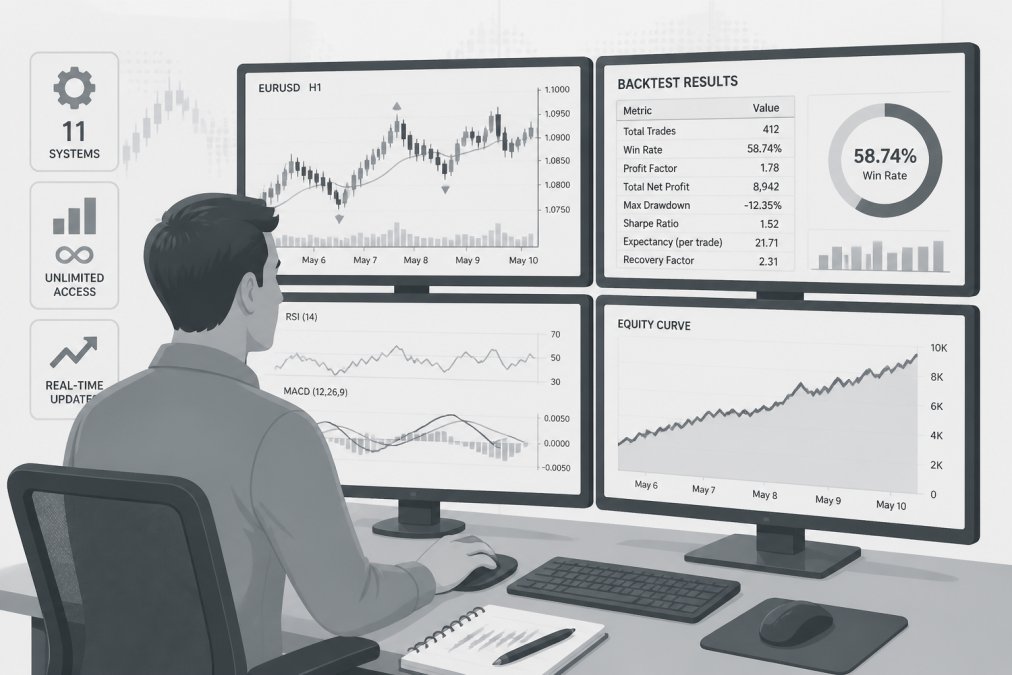
Win rate is misleading without context. The metrics that matter:
- Profit factor: Total wins divided by total losses. A ratio above 1.5 is solid.
- Expectancy: Average profit per trade. Positive expectancy means profitable.
- Sharpe ratio: Return relative to volatility. Higher is better.
- Recovery factor: Total profit divided by maximum drawdown. Higher means faster recovery.
Most traders focus only on win rate and miss these other metrics entirely.
How to Avoid Indicator Overfitting in Your Testing
Overfitting happens when you optimize your indicator parameters so precisely to historical data that the system stops working on new data. You find that 19.3 periods works perfectly on your historical data, then deploy it live and it immediately starts losing money.
The fix is out-of-sample testing. You optimize on 70% of your historical data, then test on the remaining 30% that your system has never seen. If your system performs similarly on both datasets, it’s probably real.
Psychological Bias in Indicator Interpretation
Traders interpret indicators through a psychological lens. If you’re bullish on a stock, you’ll interpret a momentum indicator as "accumulation" and ignore the divergence. This confirmation bias is why traders need rules, not guidelines.
Your entry rule should be mechanical: "Buy when RSI crosses above 50 AND moving average is pointing upward AND volume is above 20-day average." Not: "Buy when it feels like the time is right."
The most profitable traders use mechanical entry and exit rules. Emotions are removed from execution.
Out-of-Sample Testing and Forward Validation
Out-of-sample testing is testing your strategy on data it has never seen. You build your system on data from 2020-2023, then test it on 2024-2026 data without adjusting any parameters.
Forward validation is even better. You deploy a small position live and track real performance against your backtest predictions. If your backtest said the strategy should make 2% per month with 15% drawdown, and live trading shows 1.8% per month with 14% drawdown, your system is working.
Best Technical Indicators for Day Trading and Swing Trading
Different trading timeframes reward different indicators. Day trading requires faster-moving indicators that respond to intraday volatility. Swing trading works better with indicators that filter out noise and identify genuine trend changes.
Momentum Indicators and Overbought/Oversold Conditions
Momentum indicators measure the rate of price change. They’re useful for identifying when an asset has moved too far too fast.
The RSI (Relative Strength Index) ranges from 0 to 100. Readings above 70 suggest overbought conditions. Readings below 30 suggest oversold conditions. But overbought doesn’t mean "sell now." It means "be cautious about buying more."
The MACD (Moving Average Convergence Divergence) combines momentum with trend direction. When the MACD line crosses above the signal line, it suggests bullish momentum. When it crosses below, it suggests bearish momentum.
For day trading, momentum indicators work best when combined with support and resistance levels. You’re not buying every overbought signal, you’re buying overbought signals that bounce off support.
Volume-Based Analysis and Trend Confirmation
Volume tells you whether a price move is backed by real trading activity. A price breakout on high volume is more reliable than a breakout on low volume.
Volume-weighted average price (VWAP) combines price with volume to show the average price at which an asset has traded, weighted by volume. If price is above VWAP, buyers are in control. If price is below VWAP, sellers are in control.
On-balance volume (OBV) is a cumulative indicator that adds volume on up days and subtracts volume on down days. Rising OBV suggests buying pressure is increasing. Falling OBV suggests selling pressure is increasing.
Volume-based indicators work best as confirmation tools, not primary signals.
Combining Multiple Indicators for Profitable Entry and Exit Signals
The most profitable systems don’t rely on a single indicator. They combine multiple indicators from different categories to create confluence, multiple signals pointing to the same trade setup.
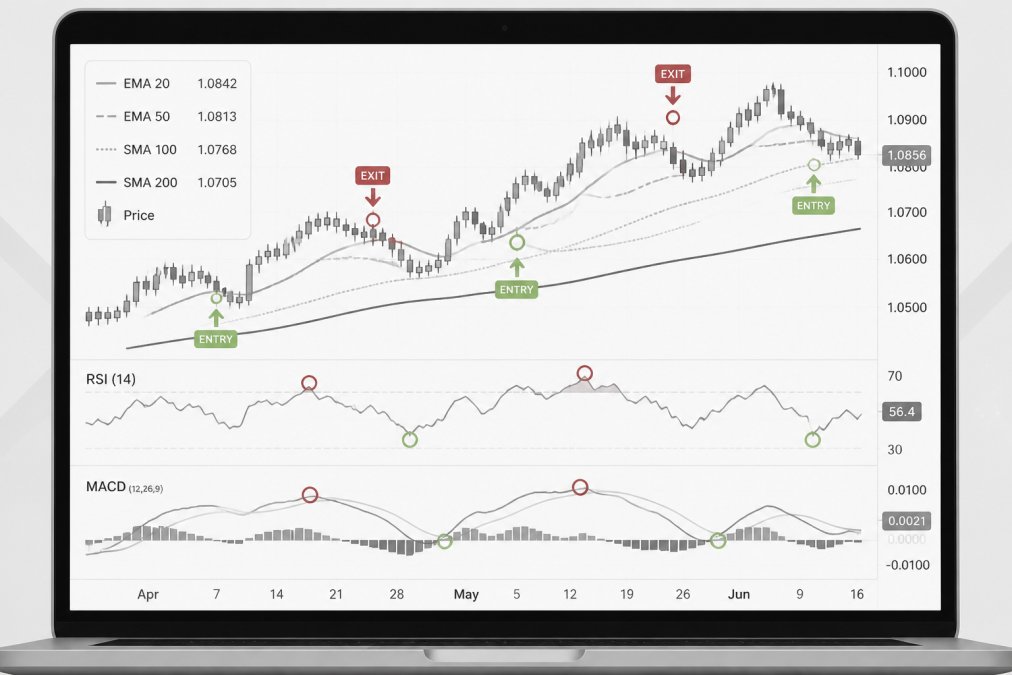
A typical high-probability setup might look like this: price is above a 200-period moving average (trend confirmation), RSI is between 40-60 (not overbought, not oversold), MACD is positive (momentum is upward), and volume is above the 20-day average (confirmation). When all four conditions align, you have a high-probability entry.
The benefit is reduced false signals. A single indicator might generate 100 signals per month. When you require four indicators to align, you might get 15 signals per month with dramatically higher win rates.
(/tradingview-indicators-for-mt5-users-a-complete-guide/) Profitable Entry and Exit Signals]
Indicator Optimization for Your Asset Class
Different assets behave differently. A moving average crossover that works great on liquid stocks might fail on cryptocurrencies. Test your indicator combination on your specific asset class.
Most traders make the mistake of testing on one asset and deploying across many. This is why they experience performance degradation.
Risk Management and Acknowledging Indicator Fallibility
No indicator is 100% accurate. Even the best systems have losing streaks. The difference between profitable traders and broke traders is how they manage risk around those losing streaks.
Position sizing is the critical tool. If you risk 1% of your account on each trade, a 10-trade losing streak costs you 10% of your account. If you risk 5% per trade, a 10-trade losing streak costs you 50%.
Most traders size based on confidence. The professional approach is fixed risk sizing. You risk the same dollar amount or percentage on every trade, regardless of confidence.
Indicator systems fail during regime changes, when market structure fundamentally shifts. A system that works great in a trending market often fails in a range-bound market. Monitor your system’s performance continuously and be prepared to stop trading it if performance degrades significantly.
Conclusion: From Testing to Live Trading
The gap between backtested results and live trading results is where most traders fail. A strategy that shows 2% monthly returns on a backtest might deliver 1% in live trading due to slippage, commissions, and the psychological difficulty of following rules during drawdowns.
EZMT5 empowers serious traders with instant, unlimited access to 11 professional, fully built, and optimized MT5 Trading Systems and TradingView indicators, plus all future systems, enabling immediate and precise automated trading with improved entries and exits. Our service delivers real-time trade opportunities and professional-grade tools, allowing users to start trading like a pro right after download. What truly sets EZMT5 apart is the commitment to flexibility, offering two license keys per system that can be changed anytime, all within a no-contract monthly subscription.
CME Group’s 2026 Trading Technology Report
Journal of Finance research on backtesting validity
CFTC guidance on retail trader risk management
| Indicator Type | Best For | Key Metric | Common Pitfall |
|---|---|---|---|
| Moving Average | Trend confirmation | Price vs MA position | Lagging in range-bound markets |
| RSI | Momentum | 30/70 overbought/oversold | False signals in strong trends |
| MACD | Trend + momentum | Histogram divergence | Whipsaws in choppy markets |
| Volume | Confirmation | Volume above average | Can lag on low-liquidity assets |
| Bollinger Bands | Volatility | Price vs bands | Expands/contracts with volatility |
Frequently Asked Questions
What's the difference between a lagging and leading indicator, and which is better for identifying profitable trading opportunities?
Lagging indicators (like moving averages) confirm trends after they've begun, while leading indicators (like the relative strength index) attempt to predict reversals before they occur. Neither is inherently better. Leading indicators generate more entry signals but produce more false positives. Lagging indicators miss early moves but offer higher-probability confirmations. Profitable traders combine both types: use leading indicators to spot potential reversals, then confirm with lagging indicators before entering. The real profit comes from signal confirmation across multiple indicator types, not from choosing one over the other.
How do I calculate trading indicator win rate and know if it's statistically significant?
Win rate is the percentage of trades that close profitably. Calculate it by dividing winning trades by total trades and multiplying by 100. However, win rate alone is misleading. A 30% win rate with large gains per trade beats a 70% win rate with small gains. Focus instead on profitability metrics: average win divided by average loss (profit factor), total net profit, and drawdown. Statistical significance requires at least 30-50 trades minimum. For day trading, this takes days or weeks; for swing trading, months. Use backtesting over 2+ years of historical data to establish whether results are repeatable or random.
How can I tell if my profitable backtest results will actually work in live trading?
Backtests often fail in live markets due to overfitting (optimizing too much to past data), slippage (actual execution prices differ from backtest assumptions), and changed market conditions. Validate your strategy using out-of-sample testing: backtest on one time period, then test the same settings on a completely separate period you didn't optimize for. If results degrade significantly, the strategy is overfit. Also run forward tests: paper trade (simulate with real prices) for 2-4 weeks before risking real capital. Monitor whether win rate, drawdown, and profitability metrics remain consistent with backtests. If they don't, the strategy needs adjustment before live deployment.
What technical indicators actually work best for day trading versus swing trading?
Day trading requires fast signals on short timeframes (5-minute to hourly charts). Momentum indicators like the relative strength index and moving average convergence divergence work well because they respond quickly to price action. Volume-weighted analysis helps confirm intraday breakouts. Swing trading (holding 2-5 days) benefits from longer-period moving averages for trend direction, pivot points for support and resistance, and volume analysis to spot institutional accumulation. The best indicator depends on your asset class: forex traders often prefer moving averages and support/resistance, stock traders benefit from volume analysis, and crypto traders may use oscillators heavily. Test your specific indicators on your actual trading timeframe and asset class before committing capital.
This article was written using GrandRanker