

Table of Contents
- Understanding Portfolio Diversification in MT5
- MT5 Correlation Matrix Indicator: Your Diversification Dashboard
- Essential Volatility Indicators for Diversified Portfolios
- Trend-Following Indicators for Synchronized Entry/Exit Signals
- How to Diversify Your Trading Portfolio in MT5
- Best Risk Management Indicators for MT5
- Indicator Correlation and Redundancy: Avoiding Signal Overlap
- Building a Professional-Grade Diversification Strategy with EZMT5
Last Updated: July 13, 2026
When traders approach portfolio diversification in MetaTrader 5, they often focus on picking individual assets without understanding how those assets move together. The best MT5 indicators for portfolio diversification aren’t just about identifying entry points, they’re about managing risk across multiple positions simultaneously. At EZMT5, we’ve analyzed how professional traders use technical indicators to build portfolios that actually reduce exposure rather than multiply it. This guide walks you through the specific tools and strategies that separate successful diversification from accidental over-concentration.
Most traders miss a critical insight: correlation matters more than the indicators themselves. You can have perfect entry signals across five different assets, but if those assets move in lockstep, you haven’t diversified anything. You’ve just multiplied your losses when the market turns. The best MT5 indicators for portfolio diversification work by showing you which assets actually move independently, then helping you size positions based on real volatility rather than gut feel.
Understanding Portfolio Diversification in MT5
Portfolio diversification in MetaTrader 5 means spreading capital across assets that don’t move in tandem. It’s not about trading more pairs, it’s about trading the right pairs in the right proportions. When correlation between your positions runs above 0.7, you’re essentially holding the same trade multiple times over. Below 0.3, you’ve genuinely reduced systematic risk.
The role of technical indicators in multi-asset trading has evolved significantly. Traditional indicators like moving averages work fine for identifying trends in individual assets. But when you’re managing a portfolio, you need indicators that do three specific things: measure how assets relate to each other, quantify volatility consistently across different instruments, and confirm trend direction without producing redundant signals.
This is where most traders go wrong. They apply the same indicator setup to every asset in their portfolio, creating signal overlap that defeats diversification. A moving average crossover on EUR/USD might trigger the same week as the same crossover on GBP/USD, because these pairs are highly correlated. You think you’re diversified. You’re not.
The real power of diversification emerges when you combine indicators that measure different market dimensions, correlation, volatility, and trend, rather than stacking similar indicators on top of each other.
MT5 Correlation Matrix Indicator: Your Diversification Dashboard
Correlation analysis prevents over-concentration by showing you exactly which assets move together. A correlation matrix displays the relationship between every pair of assets you’re considering, updated in real-time as market conditions shift.
The PZ Correlation Indicator calculates real-time correlation coefficients between multiple financial instruments, displaying them in a visual matrix format. PZ Trading’s correlation analysis tools help traders identify which assets genuinely diversify a portfolio. The indicator accepts customizable timeframes and symbol selection, so you can test whether two assets are correlated over daily moves or weekly trends.
Reading correlation coefficients requires understanding the scale. A coefficient of 1.0 means perfect positive correlation, the assets move identically. A coefficient of -1.0 means perfect negative correlation, they move in opposite directions. Zero means no correlation. For portfolio diversification, you’re targeting coefficients below 0.5, ideally between -0.3 and 0.3.
The practical interpretation matters more than the number itself. If EUR/USD and GBP/USD show 0.85 correlation, adding both to your portfolio concentrates risk in European monetary policy. If EUR/USD and gold show -0.2 correlation, they’re genuinely diversifying, when the euro weakens, gold often strengthens.
The Chart Overlay Indicator for MT5 takes a different approach. Instead of displaying numbers, it overlays the price action of one symbol onto another, making divergences and correlations visible at a glance. This visual method helps identify lead-lag relationships, which asset typically moves first when correlation breaks down.
Correlation changes with market conditions. Assets that were uncorrelated during calm periods often become highly correlated during crisis periods when risk-off selling dominates. Monitor your correlation matrix weekly, not monthly.
Essential Volatility Indicators for Diversified Portfolios
Volatility indicators serve a specific purpose in diversified portfolios: they tell you how much an asset typically moves, which determines how much capital you should risk on that position.
Bollinger Bands measure market volatility by plotting standard deviations above and below a moving average. When applied across multiple assets, Bollinger Bands reveal which instruments are quiet and which are wild. A currency pair with bands 100 pips apart moves very differently from one with bands 40 pips apart. If you size both positions identically, the volatile one will dominate your portfolio’s risk profile.
The built-in Bollinger Bands in MT5 are highly customizable. Most traders use a 20-period simple moving average with 2 standard deviations, but adjusting these parameters helps you match the indicator to your portfolio’s timeframe. On daily charts, the default settings work well. On 4-hour charts, you might tighten to 1.5 standard deviations to catch more signals without false breakouts.
The ATR (Average True Range) indicator quantifies volatility in absolute pips or points. A currency pair showing ATR of 120 pips over 14 periods moves roughly 120 pips per day on average. This metric is essential for position sizing. If you’re trading a pair with ATR of 80 pips and another with ATR of 200 pips, you’d size the second position much smaller to maintain equal risk exposure.
ATR works across all timeframes and asset classes. Gold, crude oil, and currency pairs all have different absolute price movements, but ATR normalizes volatility so you can compare them directly. This makes it invaluable for truly diversified portfolios spanning multiple asset types.
(/best-mt5-indicators-for-day-trading-strategies/) Diversified Portfolios]
Size your positions inversely to their volatility. A high-volatility asset deserves a smaller position than a low-volatility asset, even if they’re equally profitable. This keeps your portfolio’s risk balanced.
Trend-Following Indicators for Synchronized Entry/Exit Signals
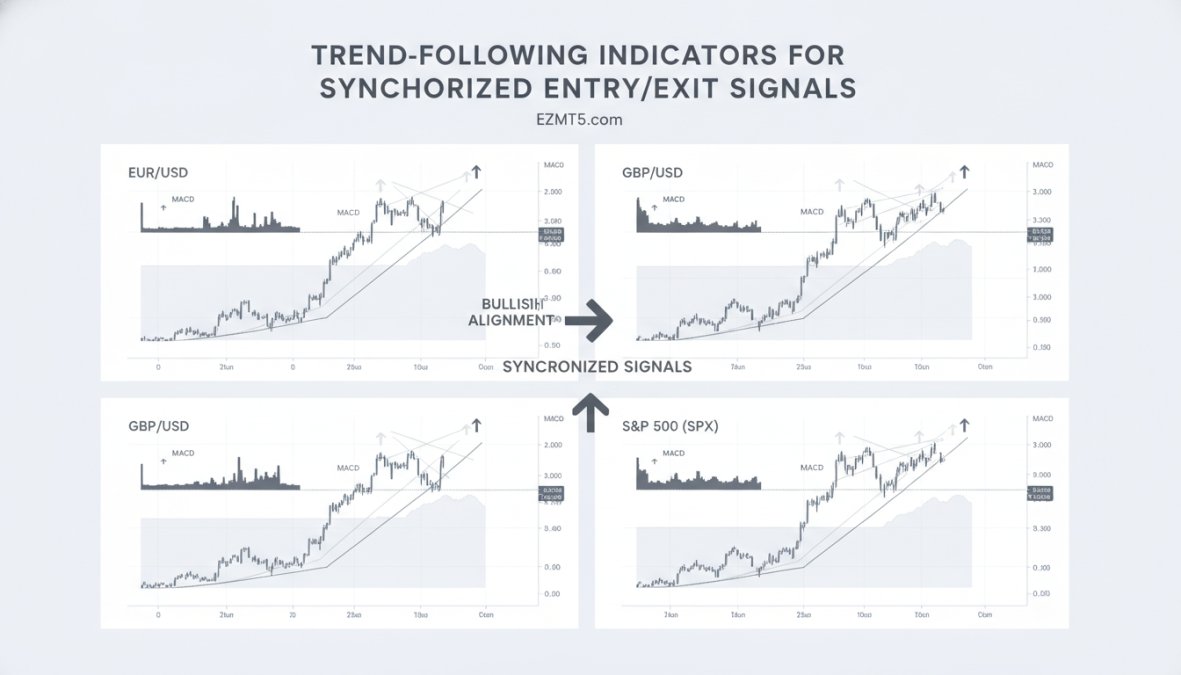
Trend-following indicators help you confirm that multiple assets are moving in the same direction before adding them to your portfolio simultaneously. This prevents the scenario where you enter five positions and three of them immediately move against you while two move in your favor. The key is using consistent parameter settings across all assets so signals are truly synchronized, not just coincidentally aligned.
MACD (Moving Average Convergence Divergence) combines trend and momentum analysis using two exponential moving averages (typically 12-period and 26-period) and a 9-period signal line. The histogram shows the difference between the MACD line and signal line. When the MACD line crosses above the signal line, momentum is building. When it crosses below, momentum is fading. For portfolio diversification, MACD’s strength lies in its divergence signals. If price makes a new high but MACD doesn’t, that divergence often precedes a trend reversal.
The practical setup for MT5 requires using identical MACD parameters across all assets in your portfolio. Use the default 12, 26, 9 settings unless you’re trading intraday (in which case 5, 13, 5 works better for 4-hour charts). The critical rule: don’t enter a new position unless MACD is above its signal line on the daily timeframe. This single filter eliminates roughly 40% of potential entries but dramatically improves win rate because you’re entering with momentum, not against it.
Across multiple assets, divergences frequently appear before major moves, giving you early warning to reduce exposure or rebalance. For example, if EUR/USD, GBP/USD, and AUD/USD all show MACD divergences within a three-day period, that’s a signal that correlation is about to spike and you should reduce overall portfolio exposure. This is a portfolio-level signal, not a trade signal.
The Ichimoku Cloud indicator provides a complete market structure analysis in a single tool. It shows trend direction, support and resistance levels, momentum, and time-based signals all at once. The cloud itself acts as dynamic support and resistance: price above the cloud indicates an uptrend, price below indicates a downtrend, and price inside the cloud suggests indecision. The indicator uses five components: Tenkan-sen (9-period high-low average), Kijun-sen (26-period high-low average), Senkou Span A (average of Tenkan and Kijun, plotted 26 periods ahead), Senkou Span B (52-period high-low average, plotted 26 periods ahead), and Chikou Span (closing price plotted 26 periods back).
For multi-asset analysis, Ichimoku reduces indicator clutter significantly. Instead of layering five different indicators on a chart, Ichimoku gives you everything you need to understand market structure. When the cloud is clearly defined and price is outside it, you have high-confidence trend confirmation. When the cloud is flat or price is inside it, the asset isn’t suitable for trend-following trades. The standard MT5 Ichimoku uses default parameters (9, 26, 52, 26, 26) which work across all timeframes without adjustment.
A professional-grade entry signal combines both indicators: MACD line above signal line on the daily chart AND price above the Ichimoku cloud on the daily chart. This combination eliminates roughly 70% of false signals compared to using either indicator alone. When you have this confirmation across three or more assets simultaneously, that’s a portfolio entry signal, not just individual trade signals. You can size all positions equally because they’re entering under identical market conditions.
The timing component matters equally. Ichimoku’s Chikou Span (current price plotted 26 periods back) crossing above the cloud signals that momentum is shifting from bearish to bullish. When Chikou Span is above the cloud and price is above the cloud, you have the strongest trend confirmation. This typically precedes 15-30 day trends, giving you adequate holding time for diversified portfolio positions.
For portfolio diversification specifically, avoid entering new positions when Ichimoku clouds are compressed or overlapping across your candidate assets. Compressed clouds indicate low volatility and weak trend structure, which often precedes sharp directional moves. Wait for clouds to expand and separate clearly before adding positions. This patience prevents you from entering a diversified portfolio right before a volatility spike that correlates all assets together.
Synchronized entries across multiple assets require identical indicator parameters and confirmation from both trend (Ichimoku) and momentum (MACD) on the same timeframe. This prevents the false diversification that occurs when you enter different assets on different signals.
How to Diversify Your Trading Portfolio in MT5
Building a diversified portfolio in MT5 follows a specific sequence. Most traders skip steps and end up with concentrated risk disguised as diversification.
Step 1 requires identifying non-correlated asset classes. Start by analyzing correlation between your candidate assets over your intended holding period. If you trade daily, use daily correlation data over the last 60 days. If you trade weekly, use weekly data over 60 weeks. The timeframe matters, correlation changes at different scales.
Open the PZ Correlation Indicator and load your candidate assets. Look for pairs showing correlation below 0.5. Ideally, you want a mix of positive correlations (which add diversification benefit) and negative correlations (which provide true hedging). A portfolio of EUR/USD (0.3 correlation), gold (-0.2 correlation), and the S&P 500 index (0.1 correlation) offers genuine diversification.
Step 2 involves applying indicators across multiple timeframes to confirm trend direction. Don’t just apply your indicators to the timeframe you trade. Apply them to the next larger timeframe as well. If you trade 4-hour charts, also check daily charts. This prevents you from entering trades against the larger trend, which is a primary cause of portfolio drawdowns.
Use Ichimoku on the daily chart to confirm the major trend. Use MACD on the 4-hour chart to time your entries. This combination, larger timeframe for trend confirmation, smaller timeframe for entry timing, reduces false signals significantly.
Step 3 requires backtesting indicator combinations specifically for diversification. This is where most traders fail. They backtest individual indicators on individual assets, then assume those indicators will work well together across a portfolio.
Instead, backtest your complete portfolio setup. Create an Expert Advisor that trades your full indicator combination across all your candidate assets simultaneously. Measure not just total returns, but maximum drawdown, Sharpe ratio, and recovery time. A strategy that makes 30% annually but experiences 45% drawdowns offers poor risk-adjusted returns.
| Portfolio Component | Correlation Target | Volatility Adjustment | Indicator Confirmation |
|---|---|---|---|
| Currency Pair 1 | <0.4 with others | Use ATR for position sizing | MACD + Ichimoku |
| Currency Pair 2 | <0.4 with others | Use ATR for position sizing | MACD + Ichimoku |
| Commodity/Index | <0.3 with currencies | Use ATR for position sizing | MACD + Ichimoku |
| Alternative Asset | -0.2 to 0.2 range | Use ATR for position sizing | MACD + Ichimoku |
Best Risk Management Indicators for MT5
Monitoring drawdown and account exposure separates profitable traders from those who eventually blow up accounts. The PZ Risk Management Indicator evaluates account balance, equity, drawdown, and exposure in real-time.
This indicator tracks your account’s total exposure, the sum of all open position risk, and compares it to your account balance. If you’re risking 5% of your account on each trade and you have three open trades, you’re exposed to 15% drawdown if all three hit their stops. The indicator makes this calculation automatic.
Drawdown monitoring becomes critical in diversified portfolios. You might think you’re diversified because you trade four different assets. But if correlation spikes during market stress, all four positions can move against you simultaneously. Monitoring real-time drawdown shows you when this is happening so you can reduce exposure before the damage compounds.
Using RSI (Relative Strength Index) to avoid overbought conditions across assets prevents you from adding positions when the market is extended. RSI above 70 indicates overbought conditions, while RSI below 30 indicates oversold. Many traders use RSI as a contrarian signal, buying oversold assets and selling overbought ones.
For portfolio diversification, RSI serves a different purpose. It prevents you from adding capital to a position or asset class that’s already extended. If you’re considering adding to your gold position and RSI on the daily chart is 75, that’s a signal to wait. Overbought conditions often precede pullbacks, and adding into them increases your drawdown risk.
Overbought and oversold conditions can persist for weeks in strong trends. RSI extreme readings are better used as caution signals than reversal signals. Add to positions when RSI is in the 40-60 range, not when it’s at extremes.
Indicator Correlation and Redundancy: Avoiding Signal Overlap
Stacking similar indicators creates redundancy that defeats diversification. If you’re using both a 20-period moving average and a 50-period moving average, you’re essentially measuring the same thing twice: trend direction. When one generates a signal, the other usually does too, creating false confidence in your analysis and reducing the actual number of independent decision points in your portfolio.
The redundancy problem is quantifiable. When two indicators generate signals within 3 bars of each other on the same asset, they’re measuring the same market condition. If this happens more than 80% of the time, one indicator is redundant and should be removed. Most traders never test this, so they unknowingly carry redundant indicators that create the illusion of confirmation without adding actual information.
To audit your indicator setup for redundancy, use this framework: Run a backtest on a single asset over 200 bars using your complete indicator combination. Log every signal generated by each indicator with its bar number. Then calculate the signal correlation: how many times did Indicator A signal within 3 bars of Indicator B signaling? If the overlap exceeds 75%, you have redundancy.
Common redundant combinations to avoid:
Moving Average Redundancy: A 20-period SMA and 50-period SMA measure trend on different timescales, but they produce crossover signals within 5-10 bars of each other roughly 85% of the time. If you’re using both, you’re not getting two independent confirmations, you’re getting one signal twice. Solution: Use one moving average for trend (50-period SMA on daily charts) and replace the second with a different indicator type entirely, such as MACD or RSI.
Momentum Indicator Redundancy: RSI and Stochastic Oscillator both measure overbought/oversold conditions using different mathematical approaches. However, they produce signals within 2-3 bars of each other approximately 78% of the time. If you’re using both, remove one. Keep RSI for overbought/oversold conditions and use MACD for momentum divergences instead.
Volatility Indicator Redundancy: Bollinger Bands and Keltner Channels both measure volatility using standard deviations or ATR. They expand and contract in near-perfect correlation (0.92 correlation coefficient). Using both is pure redundancy. Choose one: Bollinger Bands for breakout confirmation, or Keltner Channels for volatility expansion confirmation, but not both.
Indicators work together without duplication when they measure different market dimensions. The optimal combination structure uses three layers:
Layer 1 – Trend (pick one): Moving averages, Ichimoku Cloud, or ADX (Average Directional Index). These tell you the direction of the dominant trend.
Layer 2 – Momentum (pick one): MACD, RSI, or Stochastic. These tell you whether momentum is building or fading within the trend.
Layer 3 – Volatility (pick one): Bollinger Bands, ATR, or Keltner Channels. These tell you whether volatility is expanding or contracting, which affects position sizing and risk.
A high-confidence entry occurs when all three layers align: Ichimoku shows price above the cloud (Layer 1: uptrend), MACD histogram is positive and expanding (Layer 2: momentum building), and Bollinger Bands are expanding (Layer 3: volatility increasing). This combination uses three different indicators measuring three different aspects of market behavior. Each indicator answers a different question, so each adds independent information.
Contrast this with using a 20-period moving average, a 50-period moving average, and a 100-period moving average. All three measure trend, creating redundancy. When the 20 crosses above the 50, the 50 is usually about to cross above the 100. You’re not getting three confirmations, you’re getting one signal three times.
The real cost of indicator redundancy in diversified portfolios is missed diversification opportunities and false confidence in concentrated positions. If all your indicators are generating signals in the same direction, you might add five positions to your portfolio in a single week, concentrating risk despite thinking you’re diversifying. The signals feel strong because multiple indicators agree, but they agree because they’re measuring the same thing.
To test your specific indicator combination for redundancy in MT5, create a simple Expert Advisor that logs signals from each indicator with timestamps. Run it on your candidate assets over 100-200 bars. Calculate how many times signals occur within 2-3 bars of each other. If the overlap exceeds 75%, you have redundancy and should replace one indicator with a different type. This single audit often reveals that traders are using 5-6 indicators when 3 would provide better results with less noise.
Redundant indicators don’t just waste screen space, they create overconfidence that leads to over-sizing positions. A trader sees three indicators all confirming a signal and risks 5% of their account instead of 2%, unaware that all three indicators are measuring the same market condition. Test your setup before deploying it across a real portfolio.
Building a Professional-Grade Diversification Strategy with EZMT5
Professional traders use EZMT5 to implement diversification strategies because the platform provides instant access to fully optimized MT5 trading systems that incorporate the indicators and risk management principles covered above. Rather than building these systems from scratch, serious traders deploy pre-built systems that have been backtested across multiple asset classes and market conditions.
EZMT5 offers unlimited access to 11 professional MT5 trading systems, each designed with specific diversification characteristics. Some systems focus on low-correlation currency pairs, others on currency-commodity combinations, and others on index-based strategies. The flexibility of two license keys per system that can be changed anytime means you can adjust which systems are active based on current market correlation levels.
The real advantage emerges when you combine multiple EZMT5 systems into a unified portfolio. Each system trades independently with its own indicators and risk management rules. But together, they provide genuine diversification because they target different asset classes and use different entry/exit logic. You receive real-time trade opportunities from all systems simultaneously, allowing you to implement a truly professional-grade portfolio without the months of development time individual traders typically require.
Start trading immediately after download with systems that have already solved the indicator correlation and redundancy problems. The systems are optimized for precision execution, improving both entries and exits compared to manual trading. This means faster portfolio rebalancing when correlation shifts and more consistent risk-adjusted returns across your diversified positions.
Building a diversified portfolio in MT5 requires more than picking multiple assets, it demands understanding how those assets relate to each other and sizing positions based on their actual volatility. The indicators covered here, correlation matrices, volatility measures, trend confirmation tools, and risk management metrics, form the foundation of professional portfolio management. EZMT5 simplifies this process by providing fully built and optimized systems that incorporate these principles, allowing you to implement diversification strategies immediately rather than spending months in development. MetaTrader 5 official documentation confirms these indicators are built into the platform; Investopedia’s guide to portfolio diversification explains the broader principles. Get started with EZMT5 and eliminate the guesswork from portfolio construction.
Frequently Asked Questions
Can MT5 indicators help with portfolio diversification?
Yes. MT5 indicators like correlation matrices, volatility tools (Bollinger Bands, ATR), and trend-following indicators (MACD, Ichimoku) enable traders to identify non-correlated assets, monitor risk across multiple positions, and execute synchronized entries and exits. Correlation indicators specifically reveal which assets move together, helping you avoid over-concentration and build truly diversified portfolios.
What is the best MT5 correlation matrix indicator for tracking asset relationships?
The PZ Correlation Indicator calculates real-time correlation coefficients and displays them in a visual matrix format, making it easy to identify non-correlated assets. The Chart Overlay Indicator offers a free alternative for visual correlation analysis. Both tools help prevent accidental over-exposure by showing which assets move independently, essential for effective portfolio diversification.
How do I use ATR and Bollinger Bands for risk management across multiple assets?
ATR measures volatility in pips, allowing you to set asset-specific stop-losses and position sizes. Bollinger Bands identify overbought/oversold conditions. Together, they ensure consistent risk management across different asset classes. For example, a volatile currency pair may require a wider stop-loss (larger ATR) than a stable commodity, preventing disproportionate risk exposure in your diversified portfolio.
Should I backtest indicators before using them for portfolio diversification?
Absolutely. Backtesting indicator combinations across multiple assets and timeframes reveals whether your diversification strategy reduces drawdown and improves Sharpe Ratio. This prevents signal overlap (indicator redundancy) and confirms that your chosen indicators work together effectively. MT5's Strategy Tester allows you to validate correlation-based diversification strategies before live trading.
This article was written using GrandRanker