
Table of Contents
- What Is the MT5 Strategy Tester and How It Works
- Setting Up Your Backtesting Environment
- MT5 Strategy Tester Modeling Quality and Data Selection
- MT5 Optimization Explained: Parameters and Genetic Algorithms
- How to Read MT5 Strategy Tester Reports and Performance Metrics
- Leveraging Cloud Network and Advanced Testing Features
- Common Mistakes When Using MT5 Strategy Tester
- Conclusion: Mastering MT5 Strategy Tester for Precision Trading
MT5 Strategy Tester Explained: A Pro Guide
Last Updated: June 27, 2026
Understanding the MT5 Strategy Tester is fundamental for any trader serious about automated trading. Whether you’re building your first Expert Advisor or optimizing an existing system, the Strategy Tester is where theory meets reality. Below, we’ll show you exactly how to set up, configure, and interpret results from the MT5 Strategy Tester, from basic setup through advanced optimization techniques.
The biggest mistake traders make is skipping the backtesting phase entirely or running tests with poor data quality. A backtest run on tick data with proper commission and slippage settings reveals problems that forward-testing never will.
What Is the MT5 Strategy Tester and How It Works
The MT5 Strategy Tester is a built-in simulation engine that replays historical market data and executes your Expert Advisors (EAs) against that data. Think of it as a time machine: you feed it historical price data and your EA’s logic, and it shows you exactly what would have happened if your strategy had been trading during that period.
Here’s what happens during a backtest: your EA receives historical price bars or ticks, processes each price point according to your coded logic, and places trades. The tester calculates slippage, applies commission costs, and tracks the equity curve in real time. When complete, you get a detailed report showing every trade and dozens of performance metrics.
The quality of your backtest depends entirely on your data quality. Always verify that your historical data covers the period you want to test, uses the correct timeframe, and includes actual tick data if you’re testing on lower timeframes (M1, M5, M15).
Accessing the Strategy Tester via Ctrl+R
Press Ctrl+R inside MetaTrader 5 to open the Strategy Tester window at the bottom of your screen. Alternatively, go to View → Strategy Tester or click the tester icon in the toolbar.
The Strategy Tester window has three main tabs: Settings (where you configure everything), Results (displaying performance metrics after a test), and Journal (logging every action during execution).
Before running any backtest, select which Expert Advisor to test in the Settings tab. If your EA doesn’t appear, compile it first (F7 key), then it will appear in the dropdown.
Visual Mode vs. Non-Visual Mode
Visual mode replays your backtest on a chart in real time, showing each trade as it executes. This is valuable for understanding why your strategy behaves as it does. Non-visual mode runs the same backtest without the chart display, making it dramatically faster, a 5-minute visual backtest might complete in 30 seconds.
Use visual mode when debugging a new EA or investigating unexpected behavior. Use non-visual mode for optimization runs and final validation tests. To toggle between modes, check the "Visual mode" checkbox in the Settings tab.
Visual mode is CPU-intensive. If you’re testing a 10-year backtest across multiple symbols, visual mode can take hours. Save it for targeted analysis of specific periods.
Setting Up Your Backtesting Environment
The difference between a valid backtest and a misleading one comes down to environment setup.
Configuring Symbols, Timeframes, and Historical Data
Select your symbol in the Settings tab (EURUSD, GBPUSD, or other major pairs work best). Next, select your timeframe to match what your EA is designed for. If your EA trades on the 4-hour chart, select H4.
To load historical data, go to Tools → History Center inside MetaTrader 5. Select your symbol and timeframe, then click "Download". After downloading, verify your data is complete by checking the date range in the History Center. If there are gaps, your backtest will be unreliable.
The data quality setting in the Strategy Tester (under "Modeling quality") determines whether the tester uses bar data or tick data, covered in detail in the next section.
Selecting Expert Advisors and Indicators
Your Expert Advisor must be compiled and saved before it appears in the EA dropdown. Place it in your Experts folder (usually C:Users[YourUsername]AppDataRoamingMetaQuotesTerminal[TerminalID]MQL5Experts), then compile it (F7).
If your EA uses custom indicators, they must also be compiled and placed in the Indicators folder. When you run the backtest, MetaTrader will load these automatically.
To verify everything is set up correctly, run a short visual mode backtest on a few weeks of data. Watch the chart. If your indicators appear and your EA places trades, everything is wired correctly.
MT5 Strategy Tester Modeling Quality and Data Selection
Modeling quality directly affects whether your backtest results are realistic or misleading.
Understanding Tick Data vs. Bar Data
The MT5 Strategy Tester offers three modeling quality options: "Every tick", "Control points", and "Open prices only".
Every tick (highest quality): The tester reconstructs every tick from your historical data. This is the most realistic simulation, especially for EAs that trade on lower timeframes or use tight stop losses.
Control points (medium quality): The tester uses bar open, high, low, and close prices and interpolates between them. This is faster but less accurate for scalping strategies.
Open prices only (lowest quality): The tester only executes trades at the bar open price. This is fastest but least realistic. Avoid this for serious testing.
Professional traders use "Every tick" for all optimization and validation testing. The extra computation time is worth the accuracy.
Using “Open prices only” or “Control points” can hide problems that appear in live trading. The extra time spent on “Every tick” modeling saves you from deploying broken strategies.
Customizing Commission and Swap Settings
Commission is what your broker charges per trade. Swap is the overnight interest charge for holding positions. Both must be configured accurately in the Strategy Tester.
Go to Tools → Options, then find the Commission section. Enter your broker’s exact commission structure. Most brokers charge either a fixed amount per lot or a percentage of trade value.
Swap settings vary by direction. Enter your broker’s exact long and short swap rates. Getting commission and swap wrong means your backtest shows profits that won’t materialize in live trading.
MT5 Optimization Explained: Parameters and Genetic Algorithms
Optimization tests hundreds or thousands of parameter combinations to find which settings produce the best results.
Configuring Input Parameters for Testing
Identify which parameters matter. In the Strategy Tester Settings tab, find the "Parameters" section. For each parameter you want to optimize, set a start value, stop value, and step. For example, to test a moving average period from 10 to 50 with steps of 5, set: Start=10, Stop=50, Step=5.
The number of combinations grows exponentially. Three parameters with 10 values each = 1,000 combinations. Five parameters with 10 values each = 100,000 combinations. This is why non-visual mode is essential.
Click the "Optimization" checkbox to enable optimization mode, then click "Start". The tester will run through each combination and report which produced the best result according to your selected optimization criterion (profit, Sharpe ratio, profit factor, or recovery factor).
Avoiding Over-Optimization and Curve Fitting
Over-optimization occurs when you tweak parameters to fit past price action so precisely that the strategy becomes fragile. It works beautifully on tested data but breaks on new data.
The antidote is walk-forward analysis. Divide your historical period into segments. Optimize on the first segment, test the optimized parameters on the second segment without re-optimizing. This mimics real trading: you optimize, deploy, and later see if it worked.
To perform walk-forward analysis in MT5, run an optimization on the first year of data, note the best parameters, then run a single backtest with those parameters on the following year. If performance degrades significantly in the out-of-sample period, your optimization was likely curve-fitted.
Another safeguard: optimize for robustness, not maximum profit. Select "Recovery factor" or "Sharpe ratio" as your optimization criterion instead of "Profit". A strategy optimized for Sharpe ratio typically generalizes better to new data.
Optimizing 50 parameters across 20 years of data will produce a backtest that looks incredible and fails in live trading. Limit optimization to 2-4 key parameters. Test on a separate out-of-sample period.
How to Read MT5 Strategy Tester Reports and Performance Metrics
A Strategy Tester report contains dozens of metrics. Focus on the most important ones.
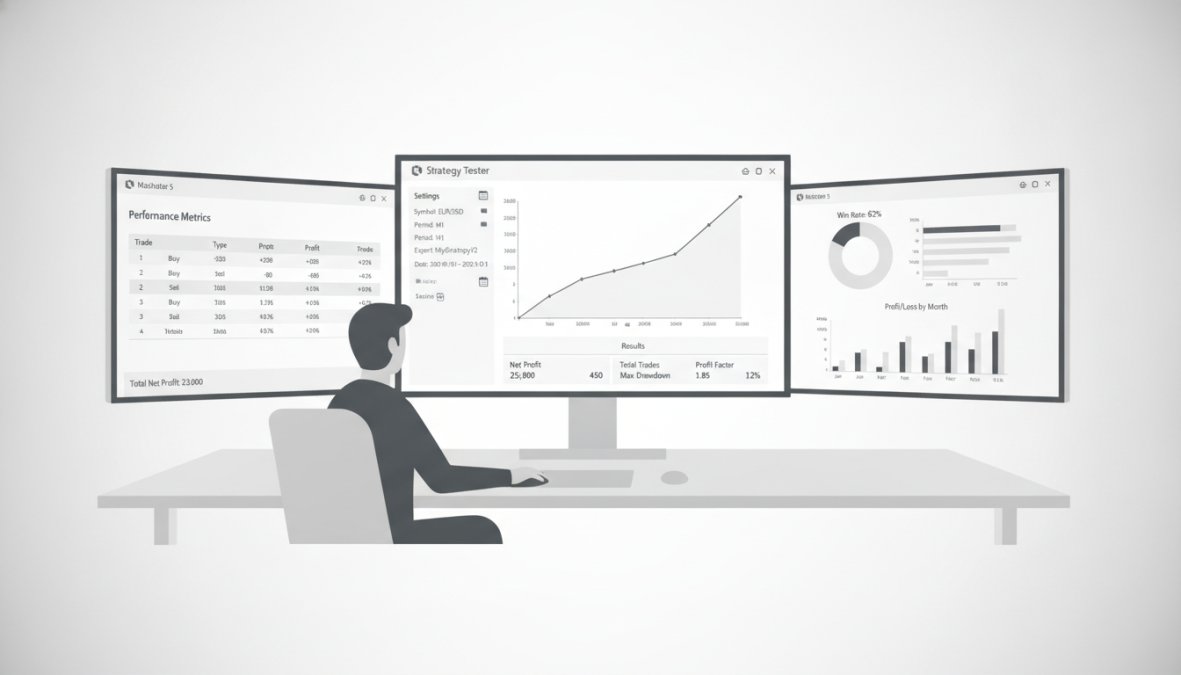
Key Metrics: Profit Factor, Sharpe Ratio, and Drawdown
Profit factor is the ratio of gross profit to gross loss. A profit factor of 2.0 means you made $2 for every $1 you lost. Anything above 1.5 is solid; above 2.0 is excellent.
Sharpe ratio measures risk-adjusted returns. A Sharpe ratio above 1.0 is good; above 2.0 is excellent. This metric is more important than raw profit because it accounts for volatility.
Maximum drawdown is the largest peak-to-trough decline in your account equity. This is psychological reality, the pain you’ll feel during losing streaks.
Other critical metrics:
- Total trades: Fewer than 50 trades means your backtest is too short or your strategy doesn’t trade often enough.
- Average win vs. average loss: If your average win is $500 and average loss is $200, you have a favorable risk-reward ratio.
- Recovery factor: Net profit divided by maximum drawdown. A recovery factor above 2.0 is strong.
The report also shows your equity curve, a graph of your account balance over time. Look for steady growth with manageable drawdowns.
Analyzing the Equity Curve and Walk-Forward Analysis
A smooth, steadily rising equity curve is ideal. A jagged curve with large dips signals high volatility. A flat curve followed by a spike suggests your strategy only works in specific market conditions.
Pay attention to the equity curve during different market periods. If it’s flat during 2015-2018 but shoots up in 2019-2021, your strategy is likely optimized for the bull market that followed.
Walk-forward analysis is the gold standard for validation:
- Divide your historical data into in-sample (optimization) and out-of-sample (validation) periods
- Run optimization on the in-sample period
- Apply those parameters to the out-of-sample period WITHOUT re-optimizing
- Compare the results
If your in-sample backtest shows 40% annual return with 20% drawdown, but the out-of-sample period shows 8% return with 35% drawdown, your optimization was curve-fitted.
Using Cloud Network and Advanced Testing Features
MetaTrader 5 offers cloud-based optimization through the MQL5 Cloud Network. Instead of running optimization on your local computer, you can distribute the work across remote servers.
To use cloud optimization, purchase MQL5 credits from the MQL5 marketplace. Open the Strategy Tester, enable optimization, and check the "Cloud" option. Your optimization job is submitted to remote servers, which run parameter combinations in parallel and return results to your terminal.
Cloud optimization is faster but costs credits. For quick local optimizations (under 1,000 combinations), local testing is fine. For massive optimization jobs (50,000+ combinations), cloud testing saves significant time.
Advanced traders also use the Strategy Tester’s "Genetic algorithm" option for optimization. Instead of testing every parameter combination, the genetic algorithm uses evolutionary logic to find optimal parameters faster. However, genetic algorithm results can be less reliable than exhaustive testing.
Common Mistakes When Using MT5 Strategy Tester
Mistake 1: Testing with incomplete data. Test at least 5-10 years of data if available. More data = more reliable results.
Mistake 2: Ignoring commission and slippage. Always test with realistic commission and slippage settings from day one.
Mistake 3: Optimizing too many parameters. Limit optimization to 2-4 key parameters to avoid curve fitting.
Mistake 4: Using "Open prices only" modeling. Use "Every tick" modeling for accurate results, even if it takes longer.
Mistake 5: Not testing different market conditions. Test through crashes, sideways markets, volatility spikes, and corrections.
Mistake 6: Deploying immediately after a great backtest. Always paper trade for at least 2-4 weeks before risking real capital.
Conclusion: Mastering MT5 Strategy Tester for Precision Trading
Backtesting is the foundation of professional automated trading. A strategy without a solid backtest is a guess, not a system.
The key to reliable backtesting is discipline: use complete historical data, accurate commission and swap settings, "Every tick" modeling quality, and walk-forward validation. Avoid over-optimization. Test through multiple market conditions. Only deploy strategies that have proven themselves on out-of-sample data.
If you’re serious about building automated trading systems, EZMT5 provides pre-built, fully optimized MT5 Trading Systems that have already passed rigorous backtesting and walk-forward analysis. Start trading like a pro immediately after download with real-time trade opportunities and precision execution.
Get started with EZMT5 and deploy professionally backtested systems in minutes, not months.
External Sources Referenced
This article draws on best practices documented across the MetaTrader 5 ecosystem. Key references include MetaQuotes official MQL5 documentation on backtesting methodology, CFTC guidelines on retail automated trading systems, and QuantInsti research on walk-forward analysis and strategy validation.
| Backtesting Element | Best Practice | Why It Matters |
|---|---|---|
| Historical Data Period | 5-10+ years minimum | Captures multiple market cycles and conditions |
| Modeling Quality | Every tick | Most realistic simulation, especially for lower timeframes |
| Commission Settings | Exact broker rates | Prevents inflated backtest results |
| Parameters to Optimize | 2-4 maximum | Reduces curve fitting and improves robustness |
| Out-of-Sample Testing | Minimum 20% of total period | Validates strategy on data not used in optimization |
| Equity Curve Shape | Steady upward trend | Indicates consistent performance, not lucky spike |
| Profit Factor Target | 1.5+ minimum | Shows wins sufficiently exceed losses |
| Sharpe Ratio Target | 1.0+ minimum | Indicates acceptable risk-adjusted returns |
Frequently Asked Questions
How do I access the MT5 Strategy Tester?
Open MetaTrader 5 and press Ctrl+R to launch the Strategy Tester. This opens the backtesting interface where you can load Expert Advisors, select symbols and timeframes, configure historical data, and run your tests. The Strategy Tester window displays your EA's performance across your chosen historical period, allowing you to optimize parameters and analyze results before live trading.
What is the difference between MT5 strategy tester modeling quality settings?
MT5 offers three modeling modes: Every Tick (most accurate, uses tick data), Control Points (faster, uses OHLC bars), and Open Prices Only (fastest, lowest accuracy). Every Tick provides the highest precision for backtesting but takes longer. For serious traders, Every Tick is recommended when testing spread, slippage, and commission impact. Choose based on your tolerance for speed versus accuracy.
How do I avoid over-optimization and curve fitting in MT5?
Over-optimization occurs when you fine-tune parameters too closely to historical data, creating a strategy that won't perform in live trading. Use walk-forward analysis to test different data periods separately. Avoid optimizing too many input parameters simultaneously. Test your EA on out-of-sample data (data not used in optimization) to verify robustness. Keep optimization focused on logical parameters, not curve-fitting random inputs.
What key metrics should I focus on when reading MT5 strategy tester reports?
Focus on: Profit Factor (gross profit divided by gross loss, aim for 1.5+), Sharpe Ratio (risk-adjusted returns), Maximum Drawdown (largest peak-to-trough decline), and Win Rate. Examine the equity curve for consistency and smooth growth. Check the Performance Report for trade statistics. These metrics together reveal whether your EA has edge or is curve-fitted. Avoid focusing solely on total profit; prioritize consistency and risk metrics.
This article was written using GrandRanker