
Table of Contents
- What Is Backtesting in Pine Script and Why It Matters
- Setting Up Your Strategy Tester in TradingView
- How to Avoid Repainting in Pine Script Backtests
- Pine Script Strategy Performance Metrics Explained
- Pine Script strategy.entry vs strategy.order: Choosing the Right Function
- TradingView Strategy Backtesting Best Practices
- Common Backtesting Pitfalls and How to Avoid Them
- How to Backtest Pine Script Strategies: A Step-by-Step Workflow
Last Updated: June 25, 2026
Knowing how to backtest Pine Script strategies separates traders who rely on gut feel from those who trade with documented edge. This guide covers the complete workflow: from writing your first strategy() function to reading the Strategy Performance Report with a professional eye. A backtest that looks profitable in TradingView is not automatically a profitable strategy. Repainting signals, ignored slippage, and curve-fitted parameters can make any garbage system look like a gold mine on historical data.
What Is Backtesting in Pine Script and Why It Matters
Backtesting in Pine Script is the process of applying a trading strategy‘s rules to historical price data to evaluate how that strategy would have performed using TradingView’s built-in Strategy Tester engine. Pine Script is TradingView’s native scripting language, and the strategy() function converts a script from a passive indicator into an active strategy capable of simulating trade execution. The value of backtesting is not confirmation, it is falsification. You are trying to prove your strategy does NOT work, and if you cannot, you have something worth trading.
Indicator vs Strategy: The Critical Difference
An indicator calculates and displays values on a chart but cannot place orders or generate a performance report. A strategy uses the strategy() function and has access to strategy.entry, strategy.exit, and strategy.close functions that simulate order execution against historical data. You cannot backtest an indicator. Many traders waste hours wondering why the Strategy Tester tab is greyed out, the answer is always the same: their script starts with indicator() instead of strategy().
Setting Up Your Strategy Tester in TradingView
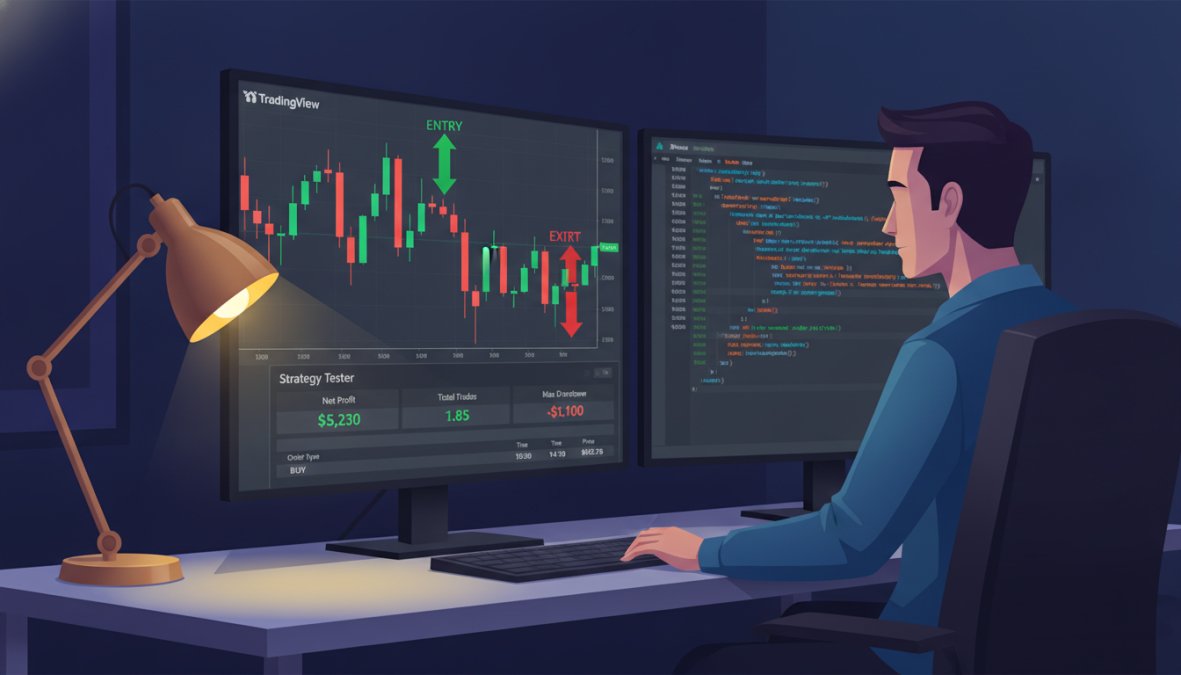
Open the Pine Editor at the bottom of any TradingView chart and write or paste your strategy script. Once the script compiles without errors, the Strategy Tester tab appears automatically at the bottom of the screen.
Essential Configuration Steps
- Click the gear icon on the Strategy Tester panel to open Properties.
- Set Initial Capital to a realistic account size.
- Set Order Size to a fixed percentage of equity (1-2%) rather than a fixed number of contracts.
- Enable Recalculate After Order is Filled to prevent look-ahead bias.
- Set Verify Price for Limit Orders to "Entire Bar" for conservative simulation.
- Choose your Currency to match your actual trading account.
Set “Fill Orders on Bar Close” to true during initial testing. It is more conservative and prevents the strategy from using intrabar price movements it could not realistically access.
Commission and Slippage: Modeling Real-World Costs
Commission represents the fee your broker charges per trade. Enter your broker’s actual commission as a percentage of trade value. For most retail futures and forex brokers, this sits between 0.01% and 0.1% per side.
Slippage is the difference between your expected fill price and your actual fill price. For liquid instruments like ES futures or major forex pairs, 1-2 ticks of slippage per trade is reasonable. For illiquid altcoins or small-cap stocks, 5-10 ticks is more realistic.
A strategy that shows a 25% annual return before costs might show 8% after realistic commission and slippage. That is the actual number you need to plan around.
How to Avoid Repainting in Pine Script Backtests
Repainting is the most dangerous problem in Pine Script backtesting. A repainting script produces signals that look perfect on historical bars but change their values as new bars form, meaning the backtest shows trades that could never have been taken in real time.
Understanding Look-Ahead Bias
Look-ahead bias occurs when a strategy uses data from the current, unclosed bar to make trading decisions. The classic example: using security() to pull higher-timeframe data without the lookahead=barmerge.lookahead_off parameter. The script sees the final, closed value of a higher-timeframe bar before that bar has actually closed.
Best Practices to Ensure Clean Signals
- Always use
close[1]instead ofclosewhen referencing the previous bar’s confirmed value. - When calling
request.security()for multi-timeframe data, always passbarmerge.lookahead_offas the lookahead parameter. - Use
barstate.isconfirmedto restrict signal generation to the close of a bar. - Avoid using
security()insideifblocks that trigger orders on the same bar. - Test your strategy on a fresh chart with no historical trades visible, then scroll back. If signals appear where they did not before, you have a repainting problem.
Using `security()` without `lookahead_off` on a strategy that trades on bar open is one of the most common sources of inflated backtest results. The fix is one parameter, but the impact on reported performance can be dramatic.
Pine Script Strategy Performance Metrics Explained
The Strategy Performance Report in TradingView gives you a structured breakdown of how your strategy behaved across all historical trades. Reading it correctly is a skill.
Key Metrics: Net Profit, Drawdown, and Profit Factor
Net profit is the total return after all commissions and slippage across the test period. A high net profit number with a short test window on a trending market is nearly meaningless.
Drawdown measures the peak-to-trough decline in equity. Maximum drawdown tells you the worst loss sequence your strategy produced. If your maximum drawdown exceeds what you can psychologically or financially tolerate, the strategy is not viable regardless of net profit.
Profit factor is gross profit divided by gross loss. A profit factor above 1.5 is generally considered the minimum threshold for a strategy worth pursuing.
Interpreting Win Rate and Equity Curve
Win rate alone tells you almost nothing. A strategy with a 35% win rate and a 3:1 reward-to-risk ratio outperforms a strategy with a 65% win rate and a 0.5:1 ratio.
The equity curve is more revealing than any single metric. A smooth, consistently rising equity curve with shallow drawdowns signals a strategy that performs across varied market conditions. A jagged equity curve with one large profitable run followed by extended flat periods signals curve fitting.
| Metric | Minimum Threshold | Strong Signal |
|---|---|---|
| Net Profit | Positive after costs | Consistent across sub-periods |
| Profit Factor | Above 1.5 | Above 2.0 |
| Max Drawdown | Below 20% of equity | Below 10% of equity |
| Win Rate | Context-dependent | Paired with R:R ratio |
| Total Trades | Above 100 | Above 300 for statistical validity |
| Sharpe Ratio | Above 1.0 | Above 1.5 |
Pine Script strategy.entry vs strategy.order: Choosing the Right Function
The choice between strategy.entry and strategy.order directly affects how your backtest simulates trade execution.
When to Use Each Function
strategy.entry is the standard function for opening positions. It respects the strategy’s pyramiding settings and automatically reverses positions when you switch direction. When you call strategy.entry("Long", strategy.long), TradingView handles position management automatically.
strategy.order gives you lower-level control. It does not reverse positions automatically and does not respect pyramiding limits in the same way. Use it when you need precise control over individual order placement, such as scaling into positions with specific lot sizes at specific price levels.
For most traders, strategy.entry paired with strategy.exit covers 95% of use cases.
TradingView Strategy Backtesting Best Practices
Building a backtest that tells you something true about a strategy’s future potential is hard. These practices separate professional-grade testing from amateur number-chasing.
Avoiding Overfitting and Curve Fitting
Overfitting is the process of optimizing a strategy’s parameters so precisely to historical data that the strategy captures noise rather than signal. The clearest sign of curve fitting: a strategy with more than 6-8 parameters that has been optimized using TradingView’s built-in Strategy Optimizer.
The fix is out-of-sample testing. Split your historical data: use 70% to develop and optimize the strategy, then test it on the remaining 30% without making any further adjustments. If performance collapses on the out-of-sample data, the strategy is overfit.
A strategy that performs well only on in-sample data is not a strategy. It is a description of the past. Out-of-sample testing is the only honest measure of forward viability.
Multi-Timeframe Backtesting Essentials
Multi-timeframe backtesting involves using signals from one timeframe to execute trades on another. The critical rule: always use request.security() with barmerge.lookahead_off when pulling higher-timeframe data. Without this, your strategy sees the final value of a higher-timeframe bar before it closes.
Paper Trading vs Backtesting: The Next Step
Backtesting validates historical performance. Paper trading validates real-time execution. After a strategy passes backtesting, connect it to TradingView’s paper trading account using Alerts and Webhooks. This tests whether your entry and exit orders trigger correctly in real time and whether the live equity curve tracks the backtested equity curve.
Common Backtesting Pitfalls and How to Avoid Them
Most backtesting failures cluster around a small set of predictable mistakes.
Debugging Strategy Logic Issues
When a strategy produces unexpected results, use plotshape() to add visual markers to your chart for every condition your strategy checks. If a shape appears where you do not expect it, the logic has a bug.
Use label.new() to print variable values directly on the chart at specific bars. This is far more effective than plot() for debugging conditional logic. Reduce your strategy to its minimum working state, then add conditions back one at a time.
Transaction Cost Modeling Mistakes
The most common transaction cost mistake is testing at zero commission and zero slippage, then being surprised when live results underperform. Model costs conservatively. If you are unsure of your broker’s exact slippage characteristics, double your estimate.
How to Backtest Pine Script Strategies: A Step-by-Step Workflow
Here is the complete workflow for how to backtest Pine Script strategies from a blank script to a validated performance report.
From Pine Editor to Strategy Performance Report
Step 1: Write your strategy script
Open Pine Editor and start with strategy("My Strategy", overlay=true, commission_type=strategy.commission.percent, commission_value=0.1, slippage=2). Define your logic, then add strategy.entry and strategy.exit calls.
Step 2: Set realistic Properties
Open Strategy Properties. Set initial capital, order size as percentage of equity, and confirm commission and slippage values match your broker.
Step 3: Enable deep backtesting
Click the date range selector in the Strategy Tester and extend it to the maximum available history.
Step 4: Check for repainting
Zoom into several historical signal points. Confirm that entry and exit markers appear on bars where the signal logically should have triggered.
Step 5: Read the Performance Report
Check net profit, profit factor, maximum drawdown, and total number of trades. Review the equity curve for consistency. Open the Trade List and scan for any anomalous trades.
Step 6: Run out-of-sample validation
Restrict the backtest date range to your development period. Record results. Then shift the date range to your holdout period. Compare. If performance holds up, proceed to paper trading.
Exporting and Analyzing Results
TradingView allows you to export the Trade List as a CSV file from the Strategy Tester panel. Load it into a spreadsheet and calculate rolling performance metrics across 20-trade windows. If any 20-trade window shows a profit factor below 1.0, investigate whether that period represents a regime the strategy cannot handle.
Understanding how to backtest Pine Script strategies at this level of technical depth is what separates traders who generate consistent edge from those who chase the next indicator. Apply this workflow to every strategy before committing real capital.
Building a strategy that survives rigorous backtesting is only half the challenge. The other half is having professional-grade tools that execute with precision when you go live. EZMT5 provides instant, unlimited access to 11 professional MT5 Trading Systems and TradingView indicators, including all future systems, with real-time trade opportunities and two license keys per system that can be changed at any time. No contracts, no waiting. Get started with EZMT5 and begin trading with documented edge from day one.
Frequently Asked Questions
How do I run a backtest in TradingView using Pine Script?
Open your Pine Script strategy in the Pine Editor, click the Strategy Tester tab on the right panel, configure your date range and initial capital, then click 'Add to Chart.' TradingView will execute your strategy against historical data and generate a strategy performance report showing net profit, drawdown, win rate, and other key metrics. You can then review the trade list and equity curve to evaluate performance.
What is the difference between strategy.entry and strategy.order in Pine Script backtests?
strategy.entry() creates entry orders that automatically close previous positions when a new entry signal fires, making it simpler for directional strategies. strategy.order() provides manual control over each order independently, allowing multiple concurrent positions. For backtesting accuracy, choose strategy.entry() for trend-following systems and strategy.order() for complex multi-leg strategies. The wrong choice can distort your backtest results significantly.
How can I avoid repainting in my Pine Script backtests?
Repainting occurs when your strategy uses future data or recalculates past signals. Avoid it by: (1) using close prices only, not high/low from incomplete candles; (2) avoiding lookahead bias by ensuring indicators reference only confirmed data; (3) testing with 'Strategy Tester' not 'Deep Backtesting' during development. Always verify your signals don't change on historical bars by checking the trade list timestamps against your chart.
What are the most important Pine Script strategy performance metrics to track?
Focus on: Net Profit (total returns), Max Drawdown (largest peak-to-trough decline), Profit Factor (gross profit divided by gross loss; aim for 1.5+), Win Rate (percentage of winning trades), and Sharpe Ratio (risk-adjusted returns). These metrics together reveal whether your strategy is profitable, stable, and realistic. Don't optimize for win rate alone, a 30% win rate with large winners can outperform a 70% win rate with small winners.
This article was written using GrandRanker