

Table of Contents
- How to Use TradingView Indicators: Accessing the Menu and Adding to Your Chart
- Best TradingView Indicators for Beginners
- How to Customize Indicator Settings and Save Templates
- How to Combine Indicators on TradingView Without Conflict
- How to Set Alerts for TradingView Indicators
- TradingView Indicator Limit on the Free Plan (And What to Do About It)
- How to Use TradingView Indicators on Mobile vs. Desktop
- Conclusion
Last Updated: June 5, 2026
Most traders open TradingView, see the chart, and immediately feel overwhelmed by the toolbar. Knowing how to use TradingView indicators is the difference between reading price action with confidence and guessing at noise. This guide from EZMT5 breaks down every step, from finding the indicators menu to combining tools without conflicts, so you can build a chart setup that actually supports your trading decisions.
Here’s what most guides get wrong: they focus on the "where" (which button to click) and skip the "why" (which indicators conflict, which ones slow your browser, and how mobile differs from desktop). The five core workflows we cover apply whether you’re scalping on a 5-minute timeframe or swing trading with weekly candles.
How to Use TradingView Indicators: Accessing the Menu and Adding to Your Chart
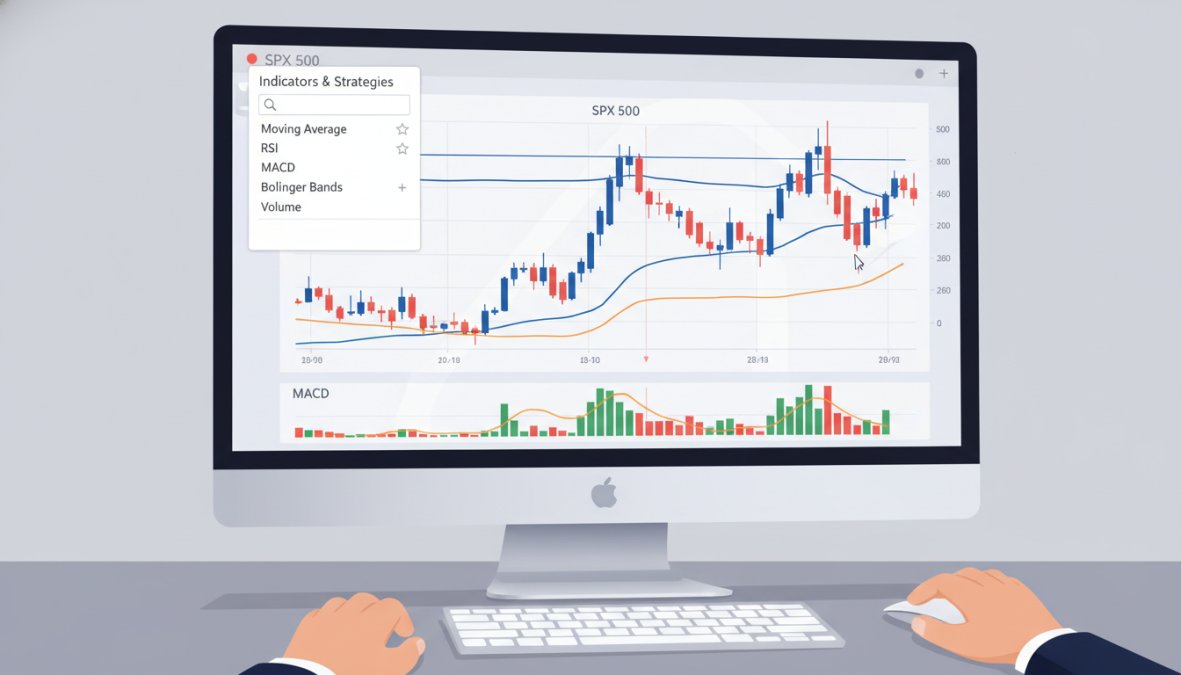
TradingView indicators live behind the Indicators button in the top toolbar, represented by a beaker icon. Clicking it opens a full search panel where you can browse built-in tools, community scripts, and your personal saved indicators.
Finding the Beaker Icon and Indicators Toolbar
The beaker icon sits in the top center toolbar of any active chart on TradingView’s Supercharts interface. To add an indicator:
- Open a chart for any asset (stock, forex pair, crypto, or index)
- Click the Indicators button (beaker icon) in the top toolbar
- Use the search bar to find a specific tool, or browse categories on the left panel
- Click an indicator name to add it directly to your chart
- The indicator appears either as a chart overlay or in a separate pane below, depending on its type
Double-clicking an indicator already on your chart opens its settings panel immediately, saving several clicks compared to right-clicking through context menus.
Built-In Indicators vs. Community Scripts
TradingView ships with over 100 built-in indicators covering the full spectrum of technical analysis. These are coded by TradingView’s own team, tested for accuracy, and optimized for performance.
Community scripts are written in Pine Script by TradingView’s user base. Some are exceptional; many are redundant; a few are broken. Built-in indicators carry a "TV" badge and load faster. Community scripts show the author’s username. For beginners, stick to built-in tools until you understand what each indicator measures. Community scripts become valuable once you know exactly what you’re looking for, such as a Fair Value Gap (FVG) detector that TradingView doesn’t include natively.
To filter community scripts by quality, sort by “Boosts” in the indicators panel. Scripts with thousands of boosts have been stress-tested by the community and are far less likely to contain calculation errors.
Best TradingView Indicators for Beginners
The best TradingView indicators for beginners answer a single, clear question about the market without requiring advanced interpretation.
Moving Averages, RSI, MACD, and Bollinger Bands Explained
These four indicators cover the core categories of technical analysis and give beginners a complete foundation:
Moving Averages smooth price action over a defined period. The 50-period and 200-period simple moving averages are widely watched by institutional traders, making them self-fulfilling at key support and resistance levels.
Relative Strength Index (RSI) measures momentum on a 0-100 scale. Readings above 70 signal overbought; below 30 signal oversold. RSI is most useful on higher timeframes, on a 15-minute chart it can stay overbought for hours during a strong trend.
MACD shows the relationship between two exponential moving averages. The histogram tells you whether momentum is accelerating or fading; a histogram crossing zero from below is a common trend reversal signal.
Bollinger Bands place two standard deviation bands above and below a central moving average. When bands contract (a "squeeze"), a breakout is likely. When price touches the upper band during an uptrend, it signals strength rather than an automatic sell.
| Indicator | What It Measures | Best Timeframe | Common Mistake |
|---|---|---|---|
| Moving Average | Trend direction | Daily, Weekly | Using too short a period |
| RSI | Momentum/overbought | 4H, Daily | Trading every extreme |
| MACD | Momentum shifts | 1H, 4H | Ignoring histogram |
| Bollinger Bands | Volatility range | Any | Treating bands as hard stops |
According to TradingView’s official indicator documentation, moving averages and RSI are consistently among the most-used indicators across all asset classes on the platform.
How to Customize Indicator Settings and Save Templates
Customizing TradingView indicator settings is where most traders gain a real edge. Default settings are generic starting points, not optimal configurations for your strategy.
Adjusting Inputs, Colors, and Visual Representation
To open an indicator’s settings panel, double-click the indicator name in the chart legend or right-click and select "Settings." You’ll find three tabs:
- Inputs: Change calculation parameters (period length, source price, multiplier)
- Style: Adjust line color, thickness, opacity, and visual representation
- Visibility: Control which timeframes display the indicator
A practical example: the default RSI uses a 14-period setting. Shorter periods (9 or 10) generate more signals; longer periods (21 or 25) reduce noise but react more slowly. The right setting depends on your strategy’s holding period.
Changing indicator colors to match your chart background accidentally hides the indicator without removing it. Always verify indicator visibility after changing style settings.
Saving Indicator Templates for Faster Dashboard Customization
Once configured, save your setup as a template so you don’t rebuild it every time you open a new chart:
- Set up all your indicators on a chart exactly as you want them
- Click the chart template icon in the top toolbar (looks like a page with a star)
- Select "Save chart layout as template"
- Name it clearly (e.g., "Swing Trade Setup" or "Scalp 5M")
- Apply it to any new chart via the same menu
Professional traders maintain separate templates for different strategies, asset classes, and timeframes, eliminating setup time and keeping analysis consistent.
How to Combine Indicators on TradingView Without Conflict
The biggest mistake traders make isn’t adding too many indicators. It’s adding indicators that measure the same thing and treating their agreement as confirmation.
Indicator Conflict Resolution: Avoiding Redundant Signals
Indicator conflict occurs when two or more indicators appear to give independent confirmation but are derived from the same underlying data. RSI and Stochastic RSI are both momentum oscillators, when both signal "oversold," you have one reason to buy counted twice, not two independent reasons.
A smarter approach limits each category to one tool:
- Trend: One moving average (e.g., 50 EMA)
- Momentum: One oscillator (RSI or MACD, not both)
- Volatility: One volatility indicator (Bollinger Bands or ATR-based tool)
- Volume: One volume indicator (Volume Profile or OBV)
This gives you four genuinely independent data points rather than six redundant ones.
Performance Impact on Browser and App When Using Multiple Indicators
Each indicator requires TradingView to recalculate historical data across every visible candle. Add ten indicators to a chart with 5,000 candles and you’re running millions of calculations every time you scroll or change timeframe. Practical effects include slower loading, lag when switching timeframes, increased browser memory consumption, and mobile app stuttering.
Limit active indicators to five or fewer per chart. Close unused chart tabs on the browser version, and avoid running more than two or three indicators simultaneously on mobile.
As documented in TradingView’s Pine Script performance optimization guide, complex community scripts with large lookback periods are the most common cause of chart slowdowns.
How to Set Alerts for TradingView Indicators
Setting alerts lets you step away from the screen without missing trade setups. To create an indicator-based alert:
- Right-click directly on the indicator line or value on your chart
- Select "Add Alert on [Indicator Name]"
- Choose the alert condition (e.g., "RSI crossing above 70" or "MACD histogram crossing 0")
- Set the notification method: popup, email, or webhook
- Define an expiration time or set it to "Open-ended"
- Click "Create"
Alert conditions for built-in indicators are pre-populated. For community scripts, the author must have included alertcondition() functions in their Pine Script code, if an alert option doesn’t appear, the author didn’t build it in.
Webhook alerts are the most powerful option. They let you connect TradingView alerts to external automation tools, including trade execution platforms, without manual intervention, how many algorithmic traders use TradingView as a signal source without writing their own execution code.
TradingView Indicator Limit on the Free Plan (And What to Do About It)
The TradingView indicator limit on the free plan is three indicators per chart. Paid plans (Essential, Plus, Premium, and Ultimate) increase this to 5, 10, 25, and 50 respectively.
Three indicators is workable if you choose carefully, the trend, momentum, and volume framework from the earlier section fits within three slots. Practical workarounds for the free plan:
- Use multi-purpose indicators that combine signals (e.g., a script that plots both a moving average and RSI)
- Prioritize chart overlays over separate panes to preserve screen space
- Save chart layouts manually by bookmarking the chart URL with your configuration
The free plan also restricts access to some community scripts labeled with a lock icon. For traders serious about a complete technical analysis workflow, evaluate the jump to a paid plan based on how often you’re hitting the indicator limit, many active traders find three indicators genuinely sufficient for clean, low-noise setups.
How to Use TradingView Indicators on Mobile vs. Desktop
The mobile and desktop experiences differ more than most guides acknowledge.
Desktop advantages:
- Full access to all indicator settings and style options
- Multi-pane layouts with indicators in separate chart windows
- Better performance with multiple indicators running simultaneously
Mobile advantages:
- Quick alerts setup directly from price taps
- Simplified indicator panel easier to navigate one-handed
- Push notifications for alerts that desktop requires a browser to receive
On mobile, add indicators by tapping the chart, then selecting the indicators icon at the bottom of the screen. Settings are condensed but include all input parameters; style options are more limited than desktop.

The most important mobile-specific tip: set your alerts on desktop, then monitor them on mobile. The alert creation interface on desktop is significantly more detailed and less error-prone.
Backtesting Indicators with the Strategy Tester
TradingView’s Strategy Tester is the backtesting engine built into the platform. It requires a Pine Script strategy rather than a standard indicator, indicators display information, strategies execute simulated trades based on defined rules.
To backtest an indicator-based strategy:
- Find a community strategy script (labeled "Strategy" rather than "Indicator" in the panel)
- Add it to your chart as you would any indicator
- Click the "Strategy Tester" tab at the bottom of the chart
- Review the performance summary, equity curve, and trade list
- Adjust input parameters in the settings panel and observe how results change
The Strategy Tester shows net profit, maximum drawdown, win rate, and profit factor across historical data. A common mistake is optimizing parameters until the backtest looks perfect, this is curve fitting, producing strategies that perform well historically but fail in live trading. Always test with default parameters first, then make conservative adjustments based on logical reasoning.
For traders who want professionally built indicator systems without the trial-and-error, EZMT5 provides instant access to 11 fully optimized TradingView indicators and MT5 trading systems, designed for precise entries and exits with real-time trade opportunities, available immediately after download under a no-contract monthly subscription.
According to TradingView’s Pine Script language reference, the strategy.entry() and strategy.exit() functions form the foundation of any backtestable Pine Script strategy, giving traders full control over stop-loss and take-profit logic.
Building a reliable indicator setup on TradingView takes more than knowing which button to click. The real challenge is choosing indicators that complement each other, configuring them for your specific strategy, and maintaining chart performance as your setup grows. EZMT5 solves this directly with 11 professional, fully built TradingView indicators and MT5 trading systems, two license keys per system with the flexibility to change them anytime, and no contract commitments. Get started with EZMT5 and begin trading with optimized entries and exits from day one.
Frequently Asked Questions
How do I add indicators to my TradingView chart?
To add indicators, open any chart on TradingView and click the beaker icon (labeled 'Indicators') in the top toolbar. A search panel will open where you can browse built-in indicators or search community scripts by name. Click any indicator to instantly add it as a chart overlay or a separate panel below your price action. You can add multiple indicators in one session without closing the menu.
Can you use multiple indicators on TradingView for free?
Yes, but the TradingView indicator limit on the free plan restricts you to a maximum of 3 indicators per chart. Paid plans (Essential, Plus, Premium, and Ultimate) progressively increase this limit, with higher tiers allowing 10 or more active indicators simultaneously. If you regularly need to combine indicators on TradingView for a complete technical analysis setup, upgrading from the free plan is worth considering.
What are the best TradingView indicators for beginners?
The best TradingView indicators for beginners are those that clearly signal trend direction and momentum without excessive chart noise. Start with Moving Averages (20 and 50 EMA) for trend identification, the Relative Strength Index (RSI) for overbought or oversold conditions, MACD for momentum shifts, and Bollinger Bands for volatility context. These four built-in indicators cover most basic trading strategy needs and pair well together without creating conflicting signals.
How do I set alerts for TradingView indicators?
To set alerts for TradingView indicators, right-click directly on the indicator line on your chart and select 'Add Alert,' or use the Alert button in the top toolbar. In the alert dialog, choose your indicator as the condition source, set the trigger value (for example, RSI crossing above 70), and select your notification method, popup, email, or webhook. Alert conditions can be tied to specific timeframes, making them useful for stop-loss and take-profit monitoring.
How do I customize TradingView indicator settings?
Click the settings gear icon that appears next to any active indicator name on your chart. The settings panel has three tabs: Inputs (where you change period lengths and calculation methods), Style (where you adjust colors and line thickness for better visual representation), and Visibility (where you control which timeframes display the indicator). After customizing, you can save the configuration as a template so it loads automatically on future charts.
Are TradingView indicators accurate for technical analysis?
TradingView indicators calculate accurately based on the historical data and exchange data feeds available on the platform. However, no indicator predicts future price action with certainty. Accuracy depends on how well the indicator suits the asset, timeframe, and market conditions you are analyzing. Using indicators to confirm signals rather than generate them in isolation, for example, combining RSI with candlestick patterns and volume profile, produces more reliable results in a complete trading strategy.
This article was written using GrandRanker