

Table of Contents
- What Are TradingView Indicators and Why They Matter
- The 10 Best TradingView Indicators for Serious Traders
- 1. Relative Strength Index (RSI): Momentum and Overbought Signals
- 2. Moving Average Convergence Divergence (MACD): Trend and Momentum Confluence
- 3. Moving Averages (SMA/EMA): Support, Resistance, and Price Action
- 4. Bollinger Bands: Volatility and Mean Reversion Signals
- 5. Volume Profile: Market Structure and Institutional Activity
- 6. Stochastic Oscillator: Overbought/Oversold Identification
- 7. Average True Range (ATR): Volatility and Risk Management
- 8. Ichimoku Cloud: Multi-Timeframe Trend and Support/Resistance
- 9. Williams %R: Momentum and Reversal Zones
- 10. On-Balance Volume (OBV): Volume-Based Price Confirmation
- How to Add Custom TradingView Indicators to Your Charts
- TradingView Indicators for Beginners: Where to Start
- Combining TradingView Indicators: Confluence Strategies That Work
- TradingView Indicator Scripts and Pine Script Optimization
- Indicator Limitations and When They Fail: What Every Trader Must Know
- Mobile vs. Desktop TradingView Indicators: Which Platform Wins
TradingView Indicators: 10 Tools That Actually Work
Last Updated: August 2026
What Are TradingView Indicators and Why They Matter
TradingView indicators transform raw price and volume data into visual signals revealing market structure and momentum shifts. They help traders identify trends, measure momentum, spot reversals, and confirm price patterns. The real edge comes from understanding how indicators work together, what professionals call confluence, rather than relying on any single tool.
How Technical Analysis Drives Better Trading Decisions
Technical indicators decode market patterns by analyzing historical price and volume behavior. When multiple indicators align, RSI confirming overbought conditions while MACD shows divergence, you’re asking the market several questions and waiting for aligned answers. This confluence increases the probability of successful trades significantly.
The 10 Best TradingView Indicators for Serious Traders
1. Relative Strength Index (RSI): Momentum and Overbought Signals
The Relative Strength Index measures recent price changes to evaluate overbought or oversold conditions. RSI oscillates between 0 and 100, with readings above 70 indicating overbought and below 30 indicating oversold territory. RSI excels at identifying divergences, situations where price makes a new high but RSI fails to confirm it, often preceding significant pullbacks.
Add RSI to TradingView by clicking the indicator icon, searching "Relative Strength Index," and adjusting the period to match your timeframe. The standard 14-period setting works well for most charts, though shorter periods like 5-7 capture faster momentum on intraday charts.
Use RSI divergences on higher timeframes (4-hour or daily) for more reliable reversal signals. A divergence on a 1-minute chart may resolve within minutes, while a 4-hour divergence often precedes multi-day moves.
2. Moving Average Convergence Divergence (MACD): Trend and Momentum Confluence
MACD combines two exponential moving averages to measure momentum and trend direction, plotting three lines: the MACD line, signal line, and histogram. When MACD crosses above its signal line, bullish momentum emerges. When it crosses below, bearish momentum appears. The histogram reveals the true power, expanding bars indicate strengthening momentum, while contracting bars suggest momentum is weakening.
Add MACD to your chart: click Indicators, search "MACD," and use default settings. MACD divergences separate skilled traders from novices. When price makes a higher high but MACD makes a lower high, hidden bearish divergence forms, frequently preceding significant reversals.
MACD lags price action. By the time MACD confirms a trend change, price has often already moved significantly. Use MACD to confirm trends already visible in price action, not as a leading indicator.
3. Moving Averages (SMA/EMA): Support, Resistance, and Price Action
Simple Moving Averages (SMA) and Exponential Moving Averages (EMA) smooth price data to reveal underlying trends. The 50-period, 100-period, and 200-period moving averages serve as key support and resistance levels across most asset classes because they represent average entry prices for large trader groups.
Price respects moving averages because institutional buyers step in at fair value levels. When price breaks below a 200-SMA on a daily chart, many traders exit long positions, creating self-fulfilling prophecies. For day traders, 9-EMA and 21-EMA combinations generate frequent signals. Longer-term traders use 50-EMA and 200-EMA to filter noise and confirm primary trend direction.
4. Bollinger Bands: Volatility and Mean Reversion Signals
Bollinger Bands consist of a middle band (20-period SMA) and upper and lower bands positioned two standard deviations away. The bands expand during high volatility and contract during low volatility. The squeeze, when Bollinger Bands contract tightly, signals that volatility is about to expand dramatically. On a 5-minute chart, a squeeze lasting 30-60 candles often precedes a 50+ pip move.
Add Bollinger Bands: click Indicators, search "Bollinger Bands," and use default 20-period SMA with 2 standard deviations.
Bollinger Bands work best in ranging markets. During strong trends, price can remain pressed against the upper or lower band for extended periods. Combine with moving averages to avoid whipsaw trades in trending markets.
5. Volume Profile: Market Structure and Institutional Activity
Volume profile displays trading activity at each price level, creating a visual map of where institutions accumulated and distributed positions. High volume nodes represent price levels where significant institutional activity occurred. The point of control (POC), the price level with the highest volume, acts as a powerful support and resistance level.
Adding volume profile to TradingView requires Premium subscription. Click Indicators, search "Volume Profile," and select your preferred type. The "Session" profile shows volume distribution for a single trading session, while "Cumulative" profile reveals longer-term institutional positioning.
6. Stochastic Oscillator: Overbought/Oversold Identification
The Stochastic Oscillator compares closing prices to the price range over a lookback period, generating values between 0 and 100. Readings above 80 indicate overbought; below 20 indicate oversold. The indicator consists of two lines: %K (main line) and %D (moving average of %K). Crossovers between these lines generate trading signals.
Stochastic excels at identifying reversal zones in ranging markets. When reaching extreme levels with divergence from price, reversals frequently follow. Add the Stochastic: click Indicators, search "Stochastic," and use the default 14-period setting.
7. Average True Range (ATR): Volatility and Risk Management
Average True Range measures market volatility by calculating the average of true ranges over a lookback period. ATR provides objective volatility measurements independent of price direction, serving two critical functions: position sizing and stop loss placement.
A trader might risk a fixed dollar amount per trade and use ATR to determine position size. If ATR is 50 pips and you’re willing to risk 100 pips, your stop loss must be 2 ATR away from entry. When ATR expands, volatility increases and position sizes shrink. When ATR contracts, volatility decreases and position sizes can increase.
Add ATR: click Indicators, search "Average True Range," and use the default 14-period setting.
8. Ichimoku Cloud: Multi-Timeframe Trend and Support/Resistance
The Ichimoku Cloud combines five technical indicators into one comprehensive system: Tenkan-sen (conversion line), Kijun-sen (base line), Senkou Span A, Senkou Span B, and Chikou Span (lagging span). When price trades above the cloud, the trend is bullish. Below the cloud, the trend is bearish. Inside the cloud indicates consolidation.
Add Ichimoku: click Indicators, search "Ichimoku Cloud," and use default settings (9, 26, 52, 26). The indicator works exceptionally well on daily and 4-hour charts.
Ichimoku provides a complete trading system in one indicator. Traders can use Ichimoku alone for complete trend analysis, support/resistance identification, and entry/exit signals.
9. Williams %R: Momentum and Reversal Zones
Williams %R measures overbought and oversold conditions similarly to Stochastic but with different calculations. The indicator oscillates between 0 and -100, with readings above -20 indicating overbought and below -80 indicating oversold. Williams %R responds quickly to price changes, making it valuable for identifying imminent reversals.
Add Williams %R: click Indicators, search "Williams %R," and use the default 14-period setting. The indicator works particularly well on intraday timeframes (5-minute through 1-hour charts).
10. On-Balance Volume (OBV): Volume-Based Price Confirmation
On-Balance Volume measures buying and selling pressure by adding volume on up days and subtracting volume on down days. OBV reveals whether volume is supporting price moves or contradicting them, a critical distinction for identifying sustainable trends versus false breakouts.
When price makes a new high but OBV fails to confirm, hidden bearish divergence forms, frequently preceding pullbacks. Add OBV: click Indicators, search "On-Balance Volume," and apply default settings.
How to Add Custom TradingView Indicators to Your Charts
Step-by-Step: Adding Indicators from the TradingView Marketplace
Click the "Indicators" button in the top toolbar. Type the indicator name you want to add, for example, "RSI" or "MACD." TradingView displays matching results with the official indicator listed first. Click the indicator name to add it to your chart.
Customize indicator parameters by clicking the gear icon next to the indicator name in the chart legend. Save your custom settings as a template: right-click on the chart, select "Save as Template," and name your setup. The next time you open a chart, load your saved template to instantly apply all preferred indicators with custom settings.
Creating Your Own Indicators with Pine Script
Pine Script is TradingView’s proprietary programming language for creating custom indicators and strategies. To create a custom indicator, click the "Pine Script Editor" button and select "New Script." The editor opens with a basic indicator template.
A simple moving average indicator in Pine Script looks like this:
study("Custom MA", overlay=true)
length = input(20, title="Period")
ma = sma(close, length)
plot(ma, color=blue, linewidth=2)
This code creates a 20-period moving average overlay on your chart. Save your script and add it to your chart. TradingView compiles the code and applies it instantly.
Start with simple indicators like moving averages before attempting complex multi-indicator systems. Study existing Pine Script code in the community library to understand syntax and best practices.
TradingView Indicators for Beginners: Where to Start
Essential Indicators Every Beginner Should Know
Beginners should master three core indicators before exploring advanced tools: moving averages, RSI, and volume. Start with a 50-period and 200-period moving average on daily charts. When price trades above both, the trend is bullish. When below both, the trend is bearish. Add RSI to identify overbought and oversold conditions within the trend. During uptrends, buy when RSI pulls back to 30-40 and price bounces off the 50-EMA. Finally, watch volume on breakouts. When price breaks above resistance with volume significantly higher than the 20-day average, the breakout is likely to sustain.
Common Beginner Mistakes with Indicators and How to Avoid Them
The most common beginner mistake is using too many indicators on one chart. More indicators create conflicting signals and analysis paralysis. Use 2-3 complementary indicators maximum.
Another critical mistake: trading indicator signals without price action confirmation. RSI showing overbought doesn’t mean price will reverse if price is trading above support and making higher highs. Beginners also fail to backtest their indicator combinations before trading real money. Use TradingView’s replay feature to test your indicator combinations on 50+ previous setups before committing capital.
Finally, beginners ignore indicator settings and use defaults for all timeframes. Faster timeframes require faster indicators (shorter periods), while longer timeframes need slower indicators (longer periods).
Combining TradingView Indicators: Confluence Strategies That Work
Why Single Indicators Fail and Multi-Indicator Confluence Succeeds
A single indicator rarely provides a complete picture. RSI shows momentum but not trend direction. Moving averages show trend but not momentum. Volume shows activity but not price direction. When traders combine indicators measuring different aspects of price action, they create a more complete analysis framework.
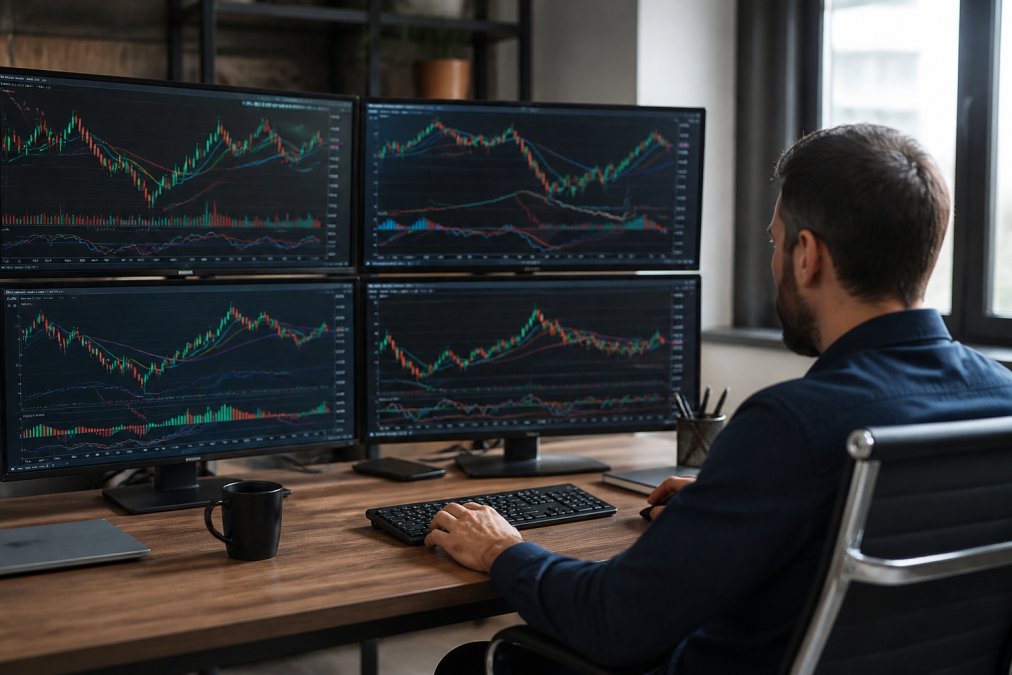
Confluence occurs when multiple independent indicators align on the same directional bias. Price trading above a rising 50-EMA (trend confirmation), RSI above 50 (bullish momentum), and volume expanding on up days (buying pressure) creates strong bullish confluence. Research shows traders using multi-indicator confluence systems experience 20-30% higher win rates compared to single-indicator traders.
Three Proven Confluence Setups: RSI + MACD, Moving Averages + Bollinger Bands, Volume + Price Action
Setup 1: RSI + MACD Confluence for Reversals
Watch for RSI reaching extreme levels (above 75 or below 25) while MACD histogram contracts and begins reversing. When both indicators show momentum exhaustion simultaneously, reversals frequently follow within 5-20 candles.
Entry: Short when RSI reaches 80 AND MACD histogram begins shrinking AND price approaches resistance. Place stop loss 50 pips above the reversal point.
Setup 2: Moving Averages + Bollinger Bands for Trend Entries
Enter long positions when price bounces off the lower Bollinger Band while trading above the 50-EMA and 200-EMA. This confluence combines trend confirmation with mean reversion.
Entry: Buy when price touches the lower Bollinger Band AND price is above both the 50-EMA and 200-EMA AND RSI is between 30-50. Place stop loss below the lower Bollinger Band.
Setup 3: Volume + Price Action for Breakout Confirmation
Enter breakouts only when volume is 50% higher than the 20-day average. This filters false breakouts occurring on low volume.
Entry: Buy when price breaks above resistance with volume expanding AND RSI is below 70 AND MACD is above its signal line. Place stop loss below the breakout level.
TradingView Indicator Scripts and Pine Script Optimization
Introduction to Pine Script: Building Automated Indicators
Pine Script enables traders to automate analysis by coding custom indicators that calculate values automatically. A practical example: creating an indicator that identifies when price closes above the 50-EMA after bouncing from the 200-EMA:
study("MA Bounce Signal", overlay=true)
ma50 = ema(close, 50)
ma200 = ema(close, 200)
signal = close > ma50 and close[1] < ma50 and low[1] > ma200
plotshape(signal, style=shape.arrowup, color=green, size=size.small)
This indicator plots an up arrow whenever price closes above the 50-EMA after previously closing below it, while staying above the 200-EMA.
Backtesting and Parameter Optimization for Custom Scripts
Pine Script includes built-in backtesting functionality through the strategy() function. Use strategy() instead of study() to create automated trading systems that execute trades based on your code. TradingView then simulates those trades on historical data and displays performance metrics.
Parameter optimization involves testing different indicator settings across historical data to find the combination producing the best results. Navigate to your strategy script, click "Add to Chart," and the strategy tester appears at the bottom. Select your testing range, then click "Run."
Backtesting results rarely match live trading results. Slippage, commissions, and market conditions change. A strategy showing 60% win rate in backtests might achieve 50% in live trading. Always start with small position sizes when trading new systems.
Indicator Limitations and When They Fail: What Every Trader Must Know
Repainting Signals and False Buy/Sell Alerts
Repainting occurs when indicator values change after the candle closes. Some poorly-coded indicators recalculate their values as new price data arrives, effectively changing historical signals. Professional Pine Script developers build indicators specifically to avoid repainting. Use the barstate.isconfirmed function to ensure calculations only occur after candles close.
False buy and sell alerts occur when indicators generate signals that don’t result in profitable trades. RSI reaching overbought doesn’t guarantee reversals; price can remain overbought during strong uptrends. The solution: use confluence. Never trade a single indicator signal without confirmation from price action or additional indicators.
Lagging Indicators vs. Real-Time Price Action
Most indicators lag price action because they calculate based on historical data. Moving averages inherently lag. MACD lags because it calculates based on moving averages. This lag means indicators confirm trends after they’ve already begun.
The best traders combine lagging indicators for confirmation with real-time price action observation. Watch price breaking above resistance in real-time, then use indicators to time your entry. Understanding this distinction separates profitable traders from struggling ones. Beginners wait for perfect indicator alignment before entering, missing the best setups. Experienced traders enter based on price action and use indicators to manage risk and time exits.
Mobile vs. Desktop TradingView Indicators: Which Platform Wins
Feature Limitations on Mobile and Workarounds
TradingView’s mobile app includes most indicators available on desktop but with significant limitations. The mobile interface displays fewer indicators simultaneously due to screen space constraints. Some advanced indicators like Volume Profile require TradingView Premium and may have reduced functionality on mobile.
Workaround: use mobile for monitoring existing setups and alerts, not for detailed analysis and entry decisions. Set up your complete analysis on desktop with all preferred indicators. Configure alerts on those setups to notify you on mobile when conditions are met.
Optimizing Your Indicator Setup for On-the-Go Trading
For mobile trading, prioritize simplicity. Use only 2-3 essential indicators that work well together. A 50-EMA, RSI, and volume combination provides complete analysis without overwhelming your mobile screen. Set up multiple chart templates for different assets and timeframes. Use TradingView’s alert feature to notify you when setups match your criteria instead of constantly checking charts.
Remember: mobile TradingView works best for execution and monitoring, not for detailed analysis. Perform your analysis on desktop where you have full access to all indicators.
Practical Comparison: Indicator Selection by Trading Style
| Trading Style | Primary Indicators | Secondary Indicators | Timeframe | Win Rate Target |
|---|---|---|---|---|
| Day Trading | RSI, MACD, Volume | Bollinger Bands | 5-15 min | 55-60% |
| Swing Trading | Moving Averages, RSI, OBV | MACD, ATR | 4-hour to Daily | 60-65% |
| Trend Following | Moving Averages, MACD | Ichimoku, Volume Profile | Daily to Weekly | 50-55% |
| Mean Reversion | Bollinger Bands, Stochastic | RSI, Volume | 1-4 hour | 60-70% |
| Breakout Trading | Volume, ATR, RSI | Moving Averages | 4-hour to Daily | 55-60% |
Key Takeaways
TradingView indicators transform raw price data into actionable signals, but no single indicator tells the complete story. The most successful traders combine multiple indicators measuring different aspects of price action, trend, momentum, volatility, and volume to create high-probability confluence setups.
Start with essential indicators like moving averages, RSI, and volume before exploring advanced tools. Master these three indicators on daily charts, then gradually add complexity as your experience grows. Avoid loading charts with 10+ indicators; simplicity improves decision-making and consistency.
Understand that all indicators lag price to some degree. Use indicators to confirm trends and time entries, not as primary signals. Watch price action first, then use indicators to manage risk and identify optimal entry points.
Test your indicator combinations thoroughly before trading real money. Backtest across 50+ setups to validate win rates. Remember that backtesting results exceed live trading results; account for slippage and commissions when evaluating strategy profitability. Start with small position sizes when trading new setups.
At EZMT5, we’ve integrated advanced indicator analysis into our 11 professional MT5 trading systems and TradingView indicators. Our systems combine multiple indicators with price action analysis to generate high-probability entry signals with improved exits. Access our complete indicator library and pre-built trading systems with your EZMT5 subscription, start trading like a professional immediately after download with two flexible license keys per system that you can change anytime.
Get started with EZMT5 and transform your trading with professional-grade indicators and automated systems that combine confluence strategies for consistent results. Our no-contract monthly subscription gives you unlimited access to all 11 trading systems plus all future systems, enabling you to trade with confidence and precision.
TradingView Official Documentation
[Pine Script(/how-long-does-it-take-to-learn-pine-script/) Language Reference Guide | tradingview.com]
Technical Analysis Principles from CMT Association
Frequently Asked Questions
What are the most accurate TradingView indicators for day trading?
The most reliable indicators combine momentum, volume, and price action. RSI identifies overbought/oversold conditions, MACD confirms trend direction and convergence/divergence, and volume-based tools like OBV validate price moves. Day traders often use confluence strategies, combining 2-3 indicators, to filter false signals. Moving averages on shorter timeframes (5-20 period) provide dynamic support and resistance. However, no single indicator is 100% accurate; backtesting and risk management are essential.
How do I add custom TradingView indicators to my charts?
To add custom TradingView indicators, open the Indicators & Strategies panel on the left sidebar, search for the indicator by name, and click to apply it to your chart. You can adjust parameters (periods, thresholds, colors) in the indicator settings. For Pine Script indicators you've written or downloaded, paste the code into the Pine Script editor, save it, and add it to your chart. Most custom indicators work on both free and premium TradingView plans, though some premium indicators require a paid subscription.
What are the best free TradingView indicators for beginners?
Beginners should start with built-in, free indicators: Moving Averages (SMA/EMA) for trend identification, RSI for momentum, MACD for convergence/divergence signals, Bollinger Bands for volatility, and Volume for confirmation. These foundational tools teach price action concepts without overwhelming complexity. Avoid overloading your chart; start with one or two indicators and master them before adding more. Many free community scripts are also available in the TradingView marketplace, look for highly-rated, well-documented indicators with clear buy/sell signals.
Can I use TradingView indicators with automated MT5 trading systems?
Yes, TradingView indicators can inform and complement automated MT5 trading systems. Many professional traders use TradingView for analysis and signal generation, then execute trades via MT5 Expert Advisors or copy-trading services. Some platforms, like EZMT5, offer fully built MT5 systems with integrated TradingView indicators that work together for precision entries and exits. This integration improves profitability by combining technical analysis with automated execution, reducing emotional decision-making and enabling real-time trade opportunities across multiple timeframes and instruments.
Why do my TradingView indicators keep giving false signals?
False signals typically occur from repainting indicators, lagging signals, or using indicators in isolation. Repainting indicators recalculate historical bars, creating misleading buy/sell alerts on backtests that don't occur in real-time trading. Lagging indicators (like moving averages) confirm trends after they've already started, causing late entries. Solution: Use non-repainting indicators, combine indicators for confluence (RSI + MACD + Volume), test on live data, and always apply risk management rules. Backtesting alone is insufficient, forward-test on recent price action before deploying real capital.
This article was written using GrandRanker