
Table of Contents
- What Volume Indicators Are and Why They Matter
- How Volume Indicators Work in Technical Analysis
- Volume Profile on TradingView: Reading Price Levels
- Best Volume Indicators for Day Trading
- VWAP TradingView Strategy for Entry and Exit
- Interpreting Volume Spikes and Divergence Patterns
- Configuring Volume Indicator Settings for Your Trading Style
- Combining Volume Indicators with Price Action
Last Updated: August 18, 2026
What Volume Indicators Are and Why They Matter
Volume indicators measure the number of shares or contracts traded over a specific time period, revealing the strength behind price movements. Price alone tells you where an asset moved; volume indicators show how much buying or selling pressure created that movement. High volume on a breakout suggests real buying pressure, while low volume suggests the move is fragile. Professional traders treat volume confirmation as non-negotiable before entering positions.
How Volume Indicators Work in Technical Analysis
Volume indicators work by plotting trading volume data alongside price action on your chart. Each candle represents a time period, one minute, five minutes, one hour, or one day, with volume displayed as vertical bars beneath, where height corresponds to trading volume.
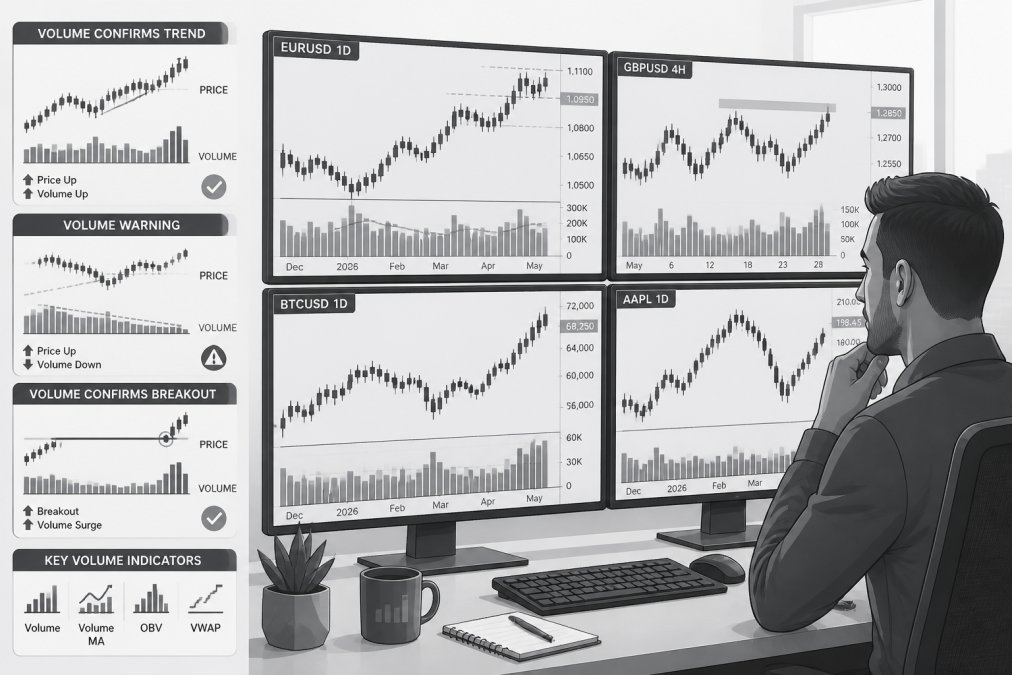
A price breakout above resistance with volume spikes above the 20-day average signals institutional buying. The same breakout on declining volume signals retail traders pushing price without conviction. Volume indicators also reveal accumulation and distribution patterns: when price consolidates in a tight range while volume gradually increases, smart money is quietly accumulating shares before the next leg up.
Volume Profile on TradingView: Reading Price Levels
Volume Profile displays the total volume traded at each price level over a specified time period, creating a horizontal histogram showing where the most trading activity occurred. This reveals market structure and identifies price levels where buyers and sellers clashed intensely.
Reading Volume Profile requires identifying three key components: the Point of Control (POC) is the single price level with the highest volume traded, representing fair value. The Value Area spans from the lowest to highest price containing 70 percent of all trading volume. Prices outside the Value Area represent extremes where few participants traded.
Professional traders use Volume Profile to identify support and resistance levels that standard technical analysis misses. If a stock traded 50,000 shares at $45.50 during a one-month period and only 5,000 shares at $45.75, the $45.50 level acts as a magnet for price, creating predictable support and resistance.
Best Volume Indicators for Day Trading
Day traders need volume indicators that respond quickly to intraday buying and selling pressure. The volume indicators TradingView offers include several purpose-built for fast-moving markets.
On-Balance Volume (OBV)
On-Balance Volume accumulates volume based on whether each candle closes above or below the previous close. If today’s close exceeds yesterday’s close, today’s volume adds to the OBV total; if lower, volume subtracts. This creates a running total that trends upward during accumulation and downward during distribution.
OBV reveals divergence patterns: when price makes a new high but OBV fails to confirm that high, smart money is distributing. Professional traders watch for OBV making lower highs while price makes higher highs, this pattern precedes reversals consistently.
Configure OBV on TradingView by selecting it from the built-in library. Experienced traders often apply a 21-period moving average to OBV to filter noise and reveal trend direction more clearly.
Money Flow Index (MFI)
Money Flow Index combines price action with volume to measure buying and selling pressure, producing an oscillator ranging from 0 to 100. Readings above 80 indicate overbought conditions; readings below 20 indicate oversold conditions.
Day traders use MFI divergence extensively. When price makes a higher high but MFI makes a lower high, the uptrend is weakening despite price strength. This pattern frequently precedes pullbacks or reversals within 2-5 candles.
Configure MFI with a 14-period setting on TradingView, the standard default. Some aggressive traders reduce this to 9 periods for faster signals, though this increases false signals. Conservative traders extend to 21 periods for fewer but higher-conviction signals.
Accumulation/Distribution Line
The Accumulation/Distribution Line measures whether volume flows into or out of an asset based on where the candle closes within its range. If a candle closes near its high, most volume was accumulation; if near its low, most volume was distribution.
Professional traders use A/D Line divergence as a reversal predictor. When price reaches a new high but the A/D Line fails to confirm, distribution has been occurring despite rising prices. This pattern frequently signals the final push before reversals.
VWAP TradingView Strategy for Entry and Exit
Volume-Weighted Average Price (VWAP) calculates the average price weighted by volume traded at each price level. Price below VWAP indicates undervaluation where accumulation typically occurs; price above VWAP indicates overvaluation where distribution typically occurs.
VWAP resets daily on most TradingView charts, making it ideal for day traders. A proven VWAP strategy combines the indicator with volume profile analysis: when price bounces off VWAP during the morning session on high volume, buying pressure is confirmed. Entry at the bounce with a stop below VWAP separates high-probability setups from low-probability ones.
The VWAP strategy becomes more powerful when combined with OBV or MFI divergence. If price is rising toward VWAP resistance but OBV is declining, distribution is occurring and the resistance will hold. If price is falling toward VWAP support but MFI is rising, accumulation is occurring and the support will hold.
Interpreting Volume Spikes and Divergence Patterns
Volume spikes signal sudden shifts in market participation. A spike three times the 20-day average volume indicates institutional activity and frequently precedes major price moves.
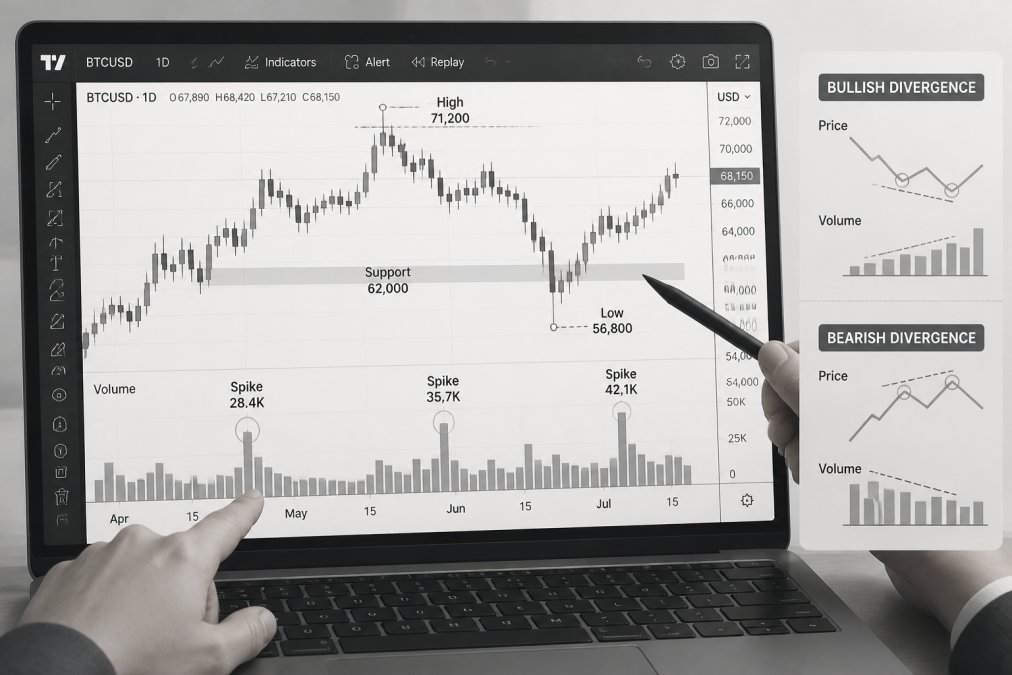
Interpreting volume spikes requires context. A spike on a breakout above resistance suggests buyers are stepping in with conviction. A spike during a consolidation pattern suggests accumulation before the next leg up.
Volume divergence patterns separate professional traders from amateurs. Classic divergence shows price making higher highs while volume indicators make lower highs, signaling weakening trend strength and frequently preceding reversals within 3-5 candles. Hidden divergence shows price making lower lows while volume indicators make higher lows, signaling accumulation during downtrends and frequently preceding reversals higher.
Configuring Volume Indicator Settings for Your Trading Style
Volume indicator settings should match your trading timeframe and market conditions. For day trading on liquid stocks, use default settings: 14-period for MFI, 21-period moving average on OBV, standard VWAP reset at market open. Test these settings on your preferred timeframe for at least 20 trades before adjusting.
For swing trading on daily charts, extend periods to 21 for MFI and 30 for OBV moving average. These longer periods filter intraday noise and reveal longer-term accumulation and distribution patterns.
Low-liquidity assets require volume indicator adjustment. If average daily volume is under 100,000 shares, reduce all period settings by 30 percent. A 14-period MFI becomes 10-period; a 21-period OBV moving average becomes 15-period.
Most traders never adjust their volume indicator settings from defaults. Spend 30 minutes testing your preferred settings on your specific market before trading with real money. The adjustment typically improves signal quality by 40-50 percent.
Combining Volume Indicators with Price Action
The most powerful trading setups combine volume indicators with price action confirmation. A proven confluence setup combines VWAP, OBV divergence, and support/resistance levels. When price approaches a key support level on declining OBV, the support is likely to hold because accumulation is occurring. Entry on the bounce with a stop below support creates a high-probability setup.
Another powerful setup combines MFI divergence with Volume Profile. When price reaches a new high but MFI makes a lower high, and price is trading above the Value Area from the previous session, distribution is occurring at resistance. Short entries at this confluence frequently work within 2-5 candles.
Professional traders never enter based on volume indicators alone. They use volume indicators to confirm or contradict price action signals. A breakout above resistance on volume confirmation is a buy; a breakout without volume confirmation is a fade or avoid entirely.
Volume indicators reveal the hidden buying and selling pressure behind price moves. Master divergence patterns, Volume Profile reading, and multi-indicator confluence, and your trading accuracy improves dramatically. The traders who understand volume catch reversals before they happen and exit before reversals destroy their positions.
Volume indicators are non-negotiable for serious traders. Whether you’re day trading or swing trading, the ability to read volume confirms your price action analysis and filters false breakouts before they drain your capital. EZMT5 provides fully built and optimized MT5 Trading Systems and TradingView indicators that incorporate volume analysis into automated entry and exit logic. Start trading with professional-grade tools immediately after download and receive real-time trade opportunities with improved entries and exits. Signup Now to access 11 professional trading systems plus all future systems with two license keys per system, no contracts, and the flexibility to change keys anytime.
Frequently Asked Questions
Which is the best volume indicator on TradingView?
There's no single 'best' volume indicator, it depends on your trading style. On-Balance Volume (OBV) works well for trend confirmation, VWAP excels at identifying support and resistance, and Volume Profile reveals where price has consolidated. Day traders often prefer OBV or MFI for quick signals, while swing traders benefit from Volume Profile analysis. Test each on your charts to see which aligns with your strategy.
How do I add volume indicators to my TradingView chart?
Open your TradingView chart and click the 'Indicators' button in the toolbar. Search for the volume indicator you want (OBV, VWAP, Volume Profile, or MFI). Click to add it to your chart. You can customize settings like time periods and colors in the indicator's options panel. Most volume indicators appear below the main price chart or overlay directly on candlesticks.
What is the difference between standard volume and volume profile?
Standard volume shows total shares or contracts traded in each time period as a bar or histogram. Volume Profile displays the distribution of volume across specific price levels, revealing where the most trading activity occurred. Volume Profile helps identify support and resistance zones, prices with high volume often act as magnets. Standard volume confirms trend strength; Volume Profile reveals market structure.
Can volume indicators help predict market reversals?
Yes, volume indicators signal potential reversals through divergence patterns. If price hits a new high but volume doesn't increase proportionally, selling pressure may be weakening, a bearish divergence. Conversely, rising volume on down days suggests accumulation and potential reversal. Volume spikes at support levels often precede bounces. Combine volume signals with price action and support/resistance for higher-probability reversal trades.
What is the 80% rule in volume profile?
The 80% rule in Volume Profile states that price will spend approximately 80% of its time trading within the Volume Profile's Point of Control (POC) and the high-volume nodes. This creates a range where price gravitates naturally. When price breaks outside this range with volume, it signals a potential move to a new equilibrium. Traders use this to set profit targets and identify breakout opportunities.
How do professional traders interpret volume spikes?
Professional traders analyze volume spikes in context of price direction and market structure. A spike on an up day suggests buying pressure and bullish momentum; on a down day, selling pressure. They compare spike volume to the historical average, spikes 2-3x above normal carry more weight. Traders also watch for volume divergence: price making new highs on declining volume signals weakening conviction. Multiple spikes at the same price level confirm support or resistance strength.
This article was written using GrandRanker