

Table of Contents
- Why 7 Best Practices for Backtesting Trading Strategies Matter
- 1. Use High-Quality Historical Data and Reliable Sources
- 2. Eliminate Look-Ahead Bias and Execution Delays
- 3. Account for Transaction Costs, Slippage, and Latency
- 4. Define Clear Entry and Exit Rules for Trading Signals
- 5. Monitor Critical Backtesting Metrics and Performance Data
- 6. Test Across Sufficient Sample Size and Multiple Timeframes
- How to Backtest a Trading Strategy Step by Step
7 Best Practices for Backtesting Trading Strategies
Last Updated: July 17, 2026
When traders test strategies on historical data, they’re attempting to predict future performance. Yet most backtesting efforts fail because they overlook critical pitfalls that inflate returns and hide real risks. Understanding the 7 best practices for backtesting trading strategies separates traders who build sustainable systems from those who chase phantom profits. Below, we’ll show you exactly how to run backtests that actually reflect what your trading strategy will do in live markets.
Why 7 Best Practices for Backtesting Trading Strategies Matter
Backtesting is how traders validate ideas before risking real capital. A poorly designed backtest can show 200% annual returns that evaporate in weeks of live trading. The gap between backtest results and real performance comes from look-ahead bias, overfitting, missing transaction costs, and flawed data quality. Research from academic finance consistently shows that strategies overfit to historical data at alarming rates, yet most traders never adjust their methodology. The 7 best practices for backtesting trading strategies exist because ignoring them costs real money.
1. Use High-Quality Historical Data and Reliable Sources
Your backtest is only as good as the data feeding it. Poor data quality introduces systematic bias that makes bad strategies look profitable.
Data quality essentials start with understanding granularity. Daily bars work for swing trading but miss intraday volatility that impacts entries and exits. Minute-level or tick data captures realistic execution conditions but requires more storage and processing power. Choose the resolution that matches your strategy’s timeframe.
Source reliability varies dramatically. Free data from Yahoo Finance works for initial exploration but contains gaps and errors. Professional data vendors like Refinitiv historical data services deliver institutional-grade feeds with minimal gaps. For forex and crypto, exchange data is preferable to broker feeds, which may reflect their own liquidity rather than true market conditions.
A common mistake is mixing data sources. Standardize on a single, reliable source for the entire test period. Data survivorship bias also distorts results. If you backtest using only stocks that exist today, you’re excluding companies that went bankrupt or delisted, which your strategy would have traded and lost on.
Before backtesting, manually verify your data against a few known price points from financial websites. Check that splits are reflected correctly and that dividend adjustments match what brokers applied.
2. Eliminate Look-Ahead Bias and Execution Delays
Look-ahead bias is the silent killer of backtesting accuracy. It happens when your strategy uses information that wouldn’t have been available at the moment you’re supposed to trade.
The most common violation: using today’s close to make today’s trading decision. In reality, you don’t know today’s close until after market hours. Your entry signal must use only data available before the bar closes. If your strategy buys when the close exceeds a moving average, that entry happens on the next bar’s open, not today’s close.
Execution delay modeling is equally critical. In live trading, there’s latency between your signal and your order reaching the market. Backtesting software that executes instantly at the signal bar underestimates slippage. A realistic model adds 1-5 bars of delay depending on your broker and market conditions. This simple adjustment often cuts backtest returns by 20-40%.
If your stop loss is supposed to trigger at a specific price during a volatile bar, you might exit at the stop price in your backtest but at a much worse price in reality if the market gaps through your stop. Use worst-case pricing during volatile bars to reflect realistic slippage.
3. Account for Transaction Costs, Slippage, and Latency
Ignoring transaction costs is the fastest way to build a strategy that looks great on paper and fails in practice.
Transaction costs include commissions, spreads, and market impact. Commissions are straightforward, add your broker’s per-trade fee or percentage. Spreads are wider in backtests than most traders assume. Even liquid instruments like EUR/USD have 1-2 pip spreads on average, and during volatile periods, spreads widen to 5-10 pips. Your backtest should model the spread your broker actually quotes.
Slippage is the difference between your expected entry price and your actual execution price. During news events or gap opens, slippage can be 10-50 pips or more. A realistic backtest models slippage as a percentage of volatility or as a fixed amount per trade. If your strategy generates 100 trades per year and each trade slips 2 pips on average, that’s 200 pips of total slippage, which can eliminate profits entirely.
Latency is the time delay between your signal and execution. Retail traders face delays of 100-500 milliseconds depending on their broker and internet connection. In fast markets, this delay translates to worse fills. Market impact is the effect your own orders have on price. For large position sizes or illiquid instruments, add 1-5% to your expected slippage to account for market impact.
4. Define Clear Entry and Exit Rules for Trading Signals
Vague entry and exit logic is a breeding ground for overfitting. "Buy when momentum is strong" is not a rule, it’s a description. A rule is precise: "Buy when the 5-period RSI crosses above 30 on the daily close."
Entry rules must specify the exact condition, the timeframe it’s measured on, and the execution method. "Enter long when price closes above the 20-day moving average" is clear. "Enter at the market open of the next bar" is explicit. When your rules are this specific, your backtest is reproducible.
Exit rules deserve equal clarity. Many traders define entries precisely but exits vaguely. Instead of "Exit when the trade is profitable," use "Exit when price closes below the 10-day moving average" or "Exit when the trade reaches +2% profit or -1% loss." Mechanical exit rules prevent emotional overrides that inflate backtest returns.
The most common mistake is letting your entry and exit rules change as you review results. Lock your rules before you backtest, or test multiple rule variations on separate data sets. Position sizing rules matter too. "Buy 2% of account equity" is dynamic and more realistic than a fixed share count. Include position sizing in your rule definition so your backtest reflects realistic capital allocation.
5. Monitor Critical Backtesting Metrics and Performance Data
Raw profit and loss numbers are misleading. A strategy that makes $50,000 but loses 60% of account equity in a drawdown is worse than one that makes $20,000 with a 15% max drawdown.
Key performance indicators: Sharpe ratio and drawdown are the two metrics that matter most. The Sharpe ratio measures risk-adjusted returns. A Sharpe ratio above 1.0 is respectable; above 2.0 is excellent. Drawdown is the peak-to-trough decline in your account equity. A strategy with 50% maximum drawdown requires you to stomach half your account vanishing before recovery.
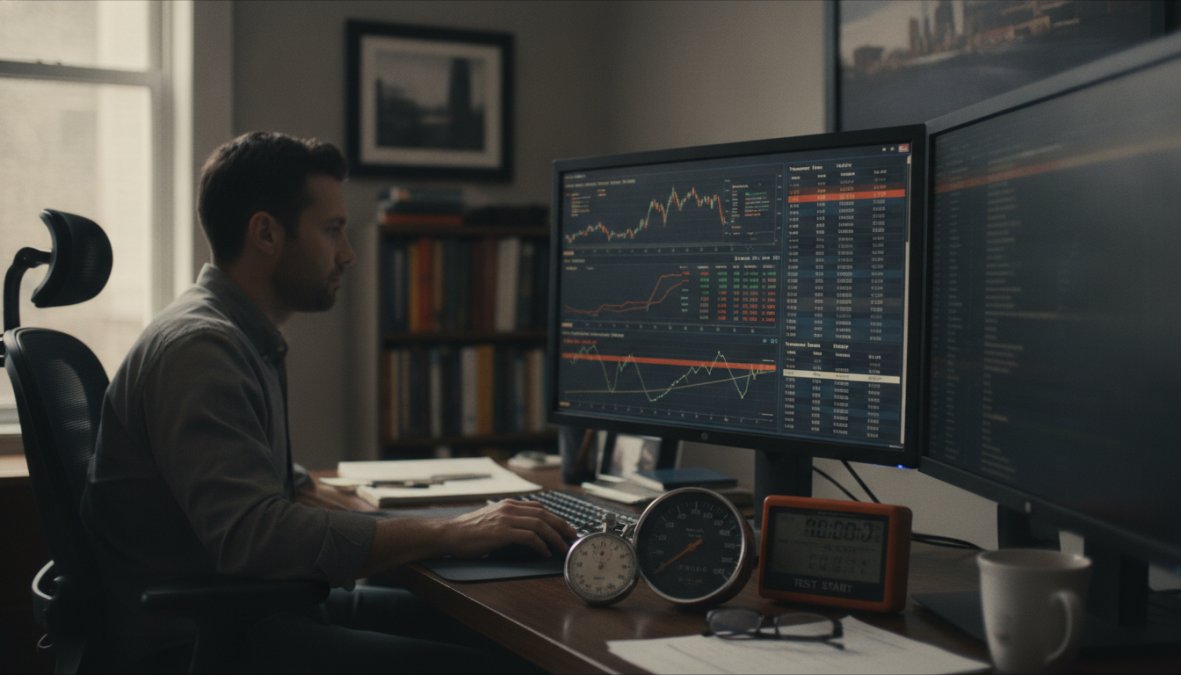
Track win rate and profit factor. Win rate is the percentage of trades that make money. Profit factor is total wins divided by total losses. A profit factor above 1.5 suggests the strategy has an edge; below 1.2 and you’re relying on luck. A strategy with a 40% win rate and a 2.0 profit factor (each win is twice the size of each loss) is viable.
Also monitor recovery factor, how quickly the strategy recovers from drawdowns. If your max drawdown is $50,000 and your average annual profit is $40,000, your recovery factor is 0.8, meaning it takes more than a year to recover from the worst drawdown.
A strategy that shows 50% annual returns with 60% drawdown and a 1.1 profit factor is worse than one showing 20% annual returns with 15% drawdown and a 1.8 profit factor. The second strategy is actually tradeable; the first will break you psychologically.
6. Test Across Sufficient Sample Size and Multiple Timeframes
A backtest with 50 trades is noise. A backtest with 500 trades is information. Statistical significance requires volume.
The minimum acceptable sample is 100 trades, but 300-500 is better. If your backtest period generates only 30 trades, extend the period backward until you have at least 100.
In-sample vs. out-of-sample testing separates real edges from curve fitting. In-sample testing uses the same historical period to both develop and test the strategy. Out-of-sample testing applies the strategy to a period it never "saw" during development. If your strategy makes 30% annual returns in-sample but only 8% out-of-sample, you’ve overfit.
Walk-forward testing is the most rigorous approach. Divide your historical data into chunks. Optimize your strategy on the first chunk, then test it on the next chunk without re-optimizing. This rolling process mimics real trading.
Multiple timeframe testing reveals whether your edge is durable. If your strategy works great on daily bars but fails on weekly bars, it’s picking up noise. Test your strategy across at least two timeframes. A strategy that works only in specific market conditions is fragile; the best strategies work across market regimes, though with varying returns.
How to Backtest a Trading Strategy Step by Step
The mechanics of backtesting vary by platform, but the process is universal. Here’s the workflow that produces realistic results.
Step 1: Define Your Strategy Rules (Time: 30 minutes)
Write down your entry condition, exit condition, and position sizing rule in plain English. This forces clarity and prevents rule changes mid-backtest.
Step 2: Choose Your Data Source and Period (Time: 15 minutes)
Select a single, reliable data vendor. Decide on the test period, typically 3-5 years for daily strategies, 6-12 months for intraday strategies.
Step 3: Configure Your Backtesting Platform (Time: 45 minutes)
Enter your commission, spread, and slippage assumptions. Set your starting capital and data resolution.
Step 4: Code or Configure Your Strategy (Time: 1-4 hours)
Translate your rules into the platform’s language. EZMT5 provides fully built MT5 trading systems that eliminate this step entirely.
Step 5: Run the Backtest (Time: 5 minutes)
Execute the backtest and let it process.
Step 6: Review Results and Metrics (Time: 30 minutes)
Examine the equity curve, drawdown, win rate, and profit factor. Does the strategy make sense? Are there large losing streaks?
Step 7: Test Out-of-Sample (Time: 30 minutes)
Apply your strategy to a period it never saw. If results degrade significantly, you’ve overfit.
Step 8: Document and Archive (Time: 15 minutes)
Save your backtest results, the rules you used, and the platform settings.
| Step | Duration | Key Output |
|---|---|---|
| Define Strategy Rules | 30 min | Written entry/exit/sizing logic |
| Choose Data & Period | 15 min | Data source, test period confirmed |
| Configure Platform | 45 min | Commission, spread, slippage set |
| Code Strategy | 1-4 hours | Strategy logic in platform language |
| Run Backtest | 5 min | Raw backtest results |
| Review Metrics | 30 min | Equity curve, Sharpe, drawdown analysis |
| Out-of-Sample Test | 30 min | Performance on unseen data |
| Document Results | 15 min | Saved backtest, rules, settings |
Manual vs. Automated Backtesting Workflows
Manual backtesting means you review charts and simulate trades by hand. Automated backtesting runs your logic through historical data algorithmically.
Manual backtesting forces you to understand your strategy deeply. You see every trade and every decision point. But manual backtesting is slow and prone to bias. You unconsciously skip over trades that would have lost. For this reason, manual backtesting is best used for initial strategy validation.
Automated backtesting is faster and unbiased. The algorithm doesn’t care if a trade loses; it executes the logic consistently. You can test thousands of trades in seconds. The downside: automated backtesting requires coding or platform configuration, and bugs in your logic can produce garbage results.
The ideal workflow combines both. Manually backtest your strategy concept on a few years of charts to build conviction. Then automate the test on the full data set to validate across larger sample sizes. If results diverge between manual and automated tests, investigate the difference, it usually reveals a logic error.
EZMT5 eliminates the backtesting burden entirely by providing 11 fully built and optimized MT5 trading systems ready to deploy. Instead of spending weeks building and testing your own logic, you get professional-grade systems that have already been validated across multiple market conditions. Real-time trade opportunities arrive automatically, and your entries and exits are executed with precision.
Backtesting is the foundation of systematic trading. A trader who skips rigorous backtesting is flying blind, hoping their intuition is better than the market’s collective intelligence. The 7 best practices for backtesting trading strategies exist because they’ve been learned through failure. Apply them, and your backtest results will reflect reality. EZMT5 simplifies this process by providing fully optimized trading systems that have already passed rigorous backtesting. Start trading immediately after download with professional-grade tools and precision execution that improves your entries and exits from day one.
Frequently Asked Questions
What are the most common backtesting pitfalls traders make?
The most critical backtesting pitfalls include look-ahead bias (using data not available at trade time), overfitting strategies to historical data, ignoring transaction costs and slippage, using insufficient historical data, and failing to test out-of-sample. Psychological bias, such as cherry-picking favorable results or ignoring drawdown periods, also distorts backtesting outcomes. Traders often overlook execution delays and latency, which significantly impact real-world performance. Avoiding these pitfalls requires disciplined testing methodology and realistic assumptions about market conditions.
How much historical data do I need for backtesting trading strategies?
The ideal sample size depends on your strategy's timeframe and asset class. Generally, aim for at least 3-5 years of historical data for daily timeframes, and longer for swing trading strategies. For intraday trading, 1-2 years may suffice if data quality is high. More data strengthens statistical significance and reduces curve-fitting risk. However, data quality matters more than quantity, ensure your brokerage data or data source accurately reflects actual market conditions, including gaps, holidays, and corporate actions. Consider testing across different market regimes (bull, bear, sideways) within your dataset.
What backtesting metrics should I focus on most?
Critical backtesting metrics include the Sharpe ratio (risk-adjusted returns), maximum drawdown (largest peak-to-trough decline), win rate (percentage of profitable trades), and profit factor (gross profit divided by gross loss). Also monitor cumulative returns, average trade duration, and recovery factor. The Sharpe ratio helps identify strategies that deliver consistent returns relative to volatility. Maximum drawdown reveals psychological resilience, can you tolerate that loss? Avoid over-optimizing for any single metric; instead, seek strategies with balanced performance across multiple indicators for robustness in live trading.
What's the difference between in-sample and out-of-sample testing?
In-sample testing uses the same historical data you optimized your strategy on, while out-of-sample testing applies the strategy to historical data it has never seen. In-sample results typically look better and risk overfitting, the strategy fits the past perfectly but fails forward. Out-of-sample testing reveals true strategy robustness by simulating real-world performance on unseen data. Best practice: use 70-80% of your data for in-sample optimization and reserve 20-30% for out-of-sample validation. This approach significantly reduces the risk of curve fitting and increases confidence that your backtesting metrics reflect genuine edge.
How do I account for slippage and transaction costs in backtesting?
Slippage and transaction costs directly erode strategy profitability. In backtesting software, configure realistic commission rates based on your broker and account size. For slippage, add a fixed amount (e.g., 1-5 pips for forex) or a percentage of the bid-ask spread to each entry and exit. The magnitude depends on market liquidity, order size, and execution speed. Many traders underestimate slippage, especially for intraday and high-frequency strategies. Test across different market conditions, slippage widens during low-liquidity periods. This realistic modeling prevents the common mistake of backtesting results that look profitable on paper but fail in live trading.
This article was written using GrandRanker