

Table of Contents
- What Are MT5 Trading Indicators for Beginners?
- The 5 Best MT5 Trading Indicators for Beginners (With How-To Steps)
- How to Install Custom Indicators on MT5 (Step-by-Step)
- MT5 Indicator Settings for Beginners: What to Adjust and What to Leave Alone
- Best MT5 Indicators for Scalping
- Simple Trading Strategies for MT5 Using Indicators
- Two Things Most Beginners Get Wrong With MT5 Indicators
- Custom Indicators vs. Built-In MT5 Tools: Which Should Beginners Use?
- Conclusion: Build Your MT5 Indicator Stack the Right Way
Last Updated: June 1, 2026
Getting started with mt5 trading indicators for beginners is one of the most searched topics among new forex and CFD traders, and for good reason: the MetaTrader 5 platform ships with dozens of built-in tools that can genuinely improve your entry and exit decisions. EZMT5 has helped serious traders cut through that noise with fully optimized MT5 trading systems, so this guide draws on that hands-on experience to show you exactly which indicators matter, how to use them, and what most beginner guides quietly get wrong. Below, we’ll walk through the five best indicators for new traders, show you how to install custom tools, and cover two critical mistakes that kill most beginners before they ever find a profitable setup.
Here’s the part most guides skip: more indicators do not mean better trades. Stacking five tools on a single chart creates conflicting signals and analysis paralysis. The traders who progress fastest pick two or three indicators, learn them deeply, and only expand their toolkit once they understand why each signal fires.
What Are MT5 Trading Indicators for Beginners?
MT5 trading indicators are mathematical calculations plotted on price charts inside MetaTrader 5 that help traders identify trends, momentum, volatility, and potential reversal points. They process historical price data and volume data to generate visual signals, giving traders a structured framework for making buy and sell decisions rather than guessing at price action alone.
The MetaTrader 5 platform includes over 80 built-in technical analysis tools, covering everything from simple overlays like Moving Averages to oscillators like the RSI and MACD. Beginners typically start with three to four indicators, then refine their selection through practice and backtesting.
Lagging Indicators vs. Leading Indicators: What’s the Difference?
This distinction matters more than most beginner guides admit.
Lagging indicators confirm trends that have already started. They follow price action and reduce false signals, but they enter trades later. Moving Averages and MACD are classic examples. The trade-off is real: you sacrifice some early profit for higher confirmation confidence.
Leading indicators attempt to predict where price will go before it gets there. RSI and CCI fall into this category. They fire earlier, which sounds attractive, but they produce more false signals, especially in strongly trending markets.
Most beginners gravitate toward leading indicators because they promise early entries. The smarter approach is combining one of each: a lagging indicator to confirm the trend direction, a leading indicator to time your entry within that trend.
Use a lagging indicator to answer “which direction?” and a leading indicator to answer “when do I get in?” Treating them as complementary tools, rather than competing ones, is the foundation of most professional MT5 strategies.
The 5 Best MT5 Trading Indicators for Beginners (With How-To Steps)
Choosing the right starting indicators comes down to simplicity, reliability, and how well each tool fits the way you actually trade. These five cover trend following, momentum, and volatility, which are the three core dimensions any beginner needs to understand before touching more advanced tools.
(/how-to-use-mt5-trading-systems/) Indicators for Beginners (With How-To Steps)]
1. Moving Averages (SMA and EMA)
The Moving Average is the starting point for almost every MT5 trader, and it earns that status. A Simple Moving Average (SMA) calculates the average closing price over a set period. An Exponential Moving Average (EMA) weights recent prices more heavily, making it faster to react to new market trends.
How to apply it in MT5:
- Open a chart and click Insert > Indicators > Trend > Moving Average
- Set Period to 20 for short-term trend analysis (50 or 200 for longer-term)
- Choose MA Method: Simple for a smoother line, Exponential for faster signals
- Apply to Close price
- Add a second Moving Average with a different period (e.g., 50) to watch for crossovers
Pros: Easy to read, works on any timeframe, excellent for confirming trend direction
Cons: Lagging by nature, generates false signals in ranging markets
The 20/50 EMA crossover is one of the most common entry signals for beginners. When the 20 EMA crosses above the 50 EMA, many traders treat that as a potential buy signal. When it crosses below, a sell signal. It is not foolproof, but it is a clean, rules-based starting point.
2. RSI (Relative Strength Index)
The RSI is a momentum indicator that measures the speed and magnitude of recent price changes to identify overbought and oversold conditions. It plots as a line oscillating between 0 and 100. Readings above 70 suggest overbought conditions; readings below 30 suggest oversold.
How to apply it in MT5:
- Click Insert > Indicators > Oscillators > Relative Strength Index
- Set Period to 14 (the standard setting for most markets)
- Set overbought level to 70 and oversold level to 30
- Watch for RSI divergence: price makes a new high but RSI does not, signaling potential reversal
Pros: Excellent for spotting potential market reversal points, works well in ranging markets
Cons: Can stay overbought or oversold for extended periods in strong trends, producing premature signals
A common RSI mistake is treating every reading above 70 as an automatic sell signal. In a strong uptrend, RSI can stay above 70 for days or weeks. Always confirm RSI signals with a trend-following indicator before acting.
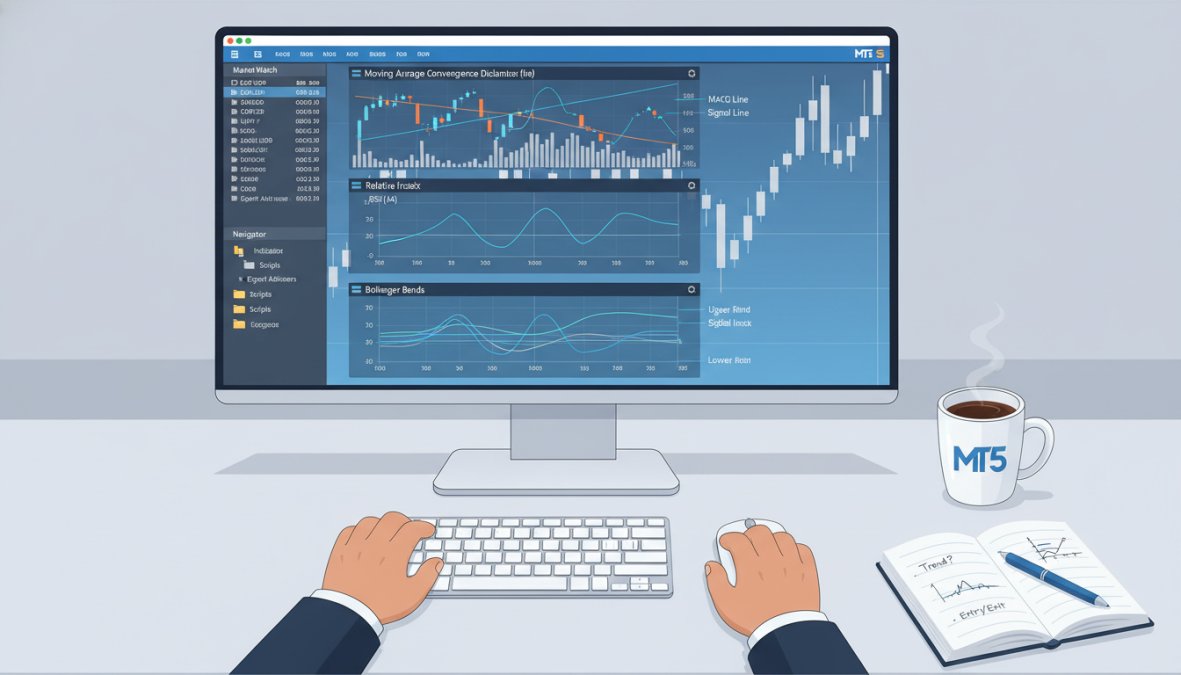
3. MACD (Moving Average Convergence Divergence)
The MACD combines trend following and momentum into a single indicator, which is why it appears on so many professional trading setups. It measures the relationship between two EMAs (typically 12 and 26 periods) and plots the difference as a histogram, along with a signal line (9-period EMA of the MACD line).
How to apply it in MT5:
- Click Insert > Indicators > Oscillators > MACD
- Default settings (12, 26, 9) work well for most beginners
- Watch for the MACD line crossing above the signal line as a potential buy signal
- Watch for histogram bars growing larger as a sign of strengthening momentum
Pros: Combines two types of analysis, histogram makes momentum shifts visually clear
Cons: Lags on fast-moving markets, generates noise on lower timeframes
According to MetaTrader’s official indicator documentation, the MACD is one of the most widely used oscillators across all asset classes, including forex, commodities, and CFDs.
4. Bollinger Bands and Volatility
Bollinger Bands plot a middle band (typically a 20-period SMA) with two outer bands set two standard deviations above and below. When price touches the upper band, the asset may be overextended. When it touches the lower band, it may be oversold. The width of the bands expands and contracts with market volatility, making this tool particularly useful for identifying breakout conditions.
How to apply it in MT5:
- Click Insert > Indicators > Trend > Bollinger Bands
- Set Period to 20 and Deviations to 2.0 (standard settings)
- Watch for price squeezes: when the bands narrow significantly, a large move is often coming
- Use band touches as context, not standalone signals
Pros: Visualizes volatility directly on the price chart, excellent for breakout setups
Cons: Bands are dynamic, so "overbought" and "oversold" readings shift constantly
5. CCI (Commodity Channel Index) and Fractals
The CCI measures the difference between an asset’s current price and its average price over a given period. It is a leading indicator that identifies cyclical turns in price, with readings above +100 suggesting overbought conditions and readings below -100 suggesting oversold.
Fractals are a simpler tool: they mark local highs and lows on the chart, identifying potential support and resistance levels. Beginners often overlook fractals, but pairing them with CCI creates a straightforward system for spotting entry points.
How to apply CCI in MT5:
- Click Insert > Indicators > Oscillators > Commodity Channel Index
- Set Period to 20
- Mark +100 and -100 as your key threshold levels
How to apply Fractals:
- Click Insert > Indicators > Bill Williams > Fractals
- Fractals appear automatically as arrows above or below bars
Pros of CCI: Versatile across timeframes, good for spotting divergence
Pros of Fractals: Objective, removes guesswork from support/resistance identification
Cons: CCI can produce whipsaw signals in choppy markets; Fractals lag by two bars (they only confirm after two bars have closed)
How to Install Custom Indicators on MT5 (Step-by-Step)
Custom indicators extend MT5 far beyond its built-in library. The MQL5 community hosts thousands of free and paid indicators, and installing them takes less than five minutes once you know the process.
What you’ll need:
- MetaTrader 5 installed and running
- A downloaded indicator file (.ex5 or .mq5 format)
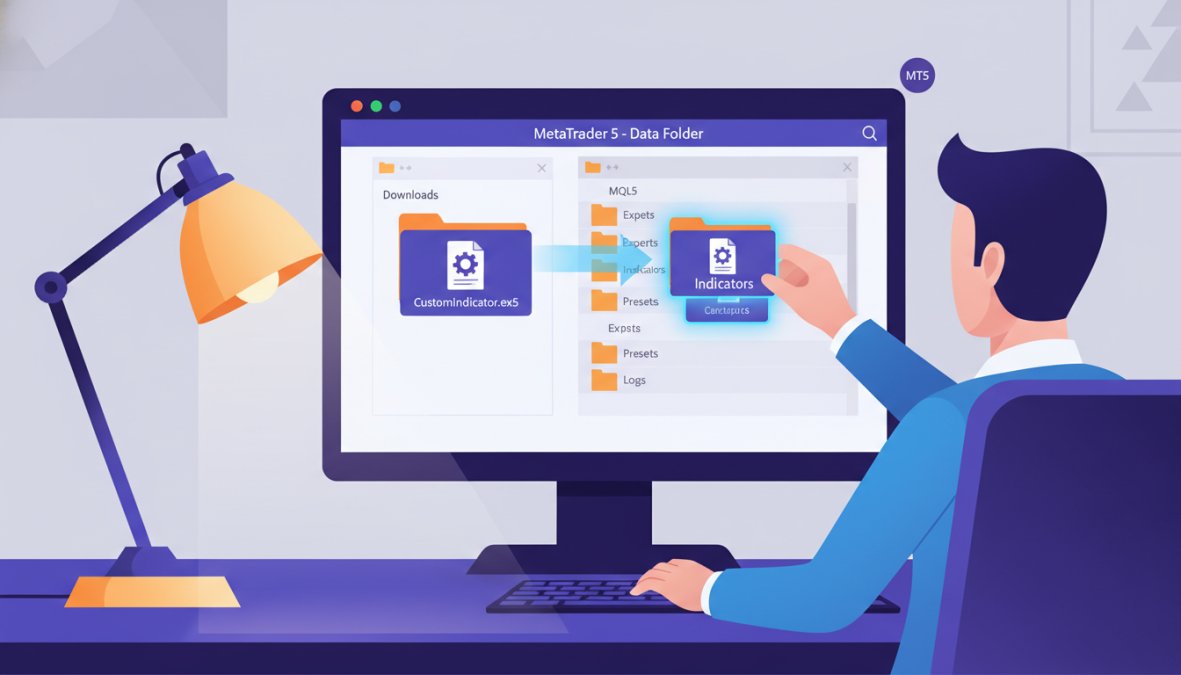
Installation steps:
- Download the indicator file to your computer
- In MT5, click File > Open Data Folder
- Navigate to MQL5 > Indicators
- Drag and drop your indicator file into that folder
- Return to MT5 and press F5 (or right-click the Navigator panel and select Refresh)
- Find your new indicator under Navigator > Indicators > Custom
- Drag it onto your chart or double-click to open its settings
Most custom indicators come with adjustable parameters. Open the indicator’s settings dialog before applying it to your chart and review each parameter. Changing period lengths or color settings can make the difference between a tool that fits your chart style and one that clutters it.
If an indicator file ends in .mq5 rather than .ex5, you need to compile it first. Open MetaEditor (press F4 in MT5), load the .mq5 file, and press F7 to compile. MT5 will generate the .ex5 file automatically.
MT5 Indicator Settings for Beginners: What to Adjust and What to Leave Alone
The most destructive habit beginners develop with MT5 indicator settings is not ignorance, it is over-confidence. Changing a period from 14 to 11 because it "looks better" on last month’s EUR/USD chart is how curve fitting starts. This section covers what each default setting actually means, which ones are safe to adjust and why, and how to use MT5’s built-in Strategy Tester to check whether a setting change is a genuine improvement or just a better fit to historical noise.
Why the Defaults Exist (and Why They Are Not Arbitrary)
Most MT5 indicator defaults were not chosen randomly. They reflect decades of practitioner consensus across liquid markets:
- RSI Period 14: Developed by J. Welles Wilder and published in 1978, the 14-period setting was calibrated to roughly half a trading month. It balances responsiveness against noise across daily charts. On lower timeframes, the same logic holds proportionally.
- MACD (12, 26, 9): The 12 and 26 periods correspond to roughly two and four trading weeks of daily data. The 9-period signal line smooths the MACD line enough to reduce whipsaws without adding significant lag. These settings became standard because they were widely adopted, which itself creates a self-reinforcing effect: more traders watching the same crossovers means those crossovers carry more market weight.
- Bollinger Bands (20, 2.0): The 20-period SMA sits at the midpoint of a trading month. The 2.0 standard deviation setting means, statistically, price should remain inside the bands roughly 95% of the time under normal distribution assumptions. Reducing this to 1.5 dramatically increases the frequency of band touches, most of them meaningless.
Understanding the logic behind a default makes it far easier to decide when adjusting it is justified.
What to Adjust, and the Right Reason to Do It
Period length: Shortening a period makes an indicator react faster but increases false signals. Lengthening it smooths the line but increases lag. The only valid reason to adjust a period is a mismatch between your trading timeframe and the indicator’s effective lookback window. A 14-period RSI on a 1-minute chart looks back 14 minutes. On a daily chart, it looks back 14 days. If you are scalping on a 1-minute chart and finding RSI too slow, shortening to 7 is defensible, but test it before using it live.
Color and line style: Purely cosmetic. Making your 20 EMA a different color from your 50 EMA is not optimization, it is readability. Do this freely.
Alert thresholds: MT5 allows indicators to trigger pop-up, sound, email, or push notification alerts when conditions are met. Setting an RSI alert at 70 and 30 means you do not need to watch the chart constantly. This is a workflow improvement, not a strategy change.
What to Leave Alone (Until You Can Justify the Change)
| Setting | Default | Common Beginner Change | Why It Usually Backfires |
|---|---|---|---|
| RSI Period | 14 | 9 or 7 | More signals, but most are noise on higher timeframes |
| MACD Fast/Slow | 12, 26 | 5, 13 | Works on backtests of trending markets; fails in ranging conditions |
| Bollinger Deviations | 2.0 | 1.5 | Triples the number of band touches; most are false breakouts |
| EMA Period (trend) | 20/50 | 10/30 | Increases crossover frequency; more whipsaws in sideways markets |
The Curve Fitting Trap: How to Spot It Before It Costs You Money
Curve fitting, also called over-optimization, happens when you adjust indicator settings until they perfectly predict a specific historical dataset. The settings look brilliant on the chart you tested them on. They fail on the next month of data because they were calibrated to that dataset’s noise, not to any repeatable market structure.
MT5 has a built-in tool that beginners almost never use for this purpose: the Strategy Tester (keyboard shortcut: Ctrl+R).
How to use the Strategy Tester to validate a setting change:
- Press Ctrl+R in MT5 to open the Strategy Tester
- Select "Indicator" from the Type dropdown (not Expert Advisor)
- Choose the indicator you want to test
- Set your date range to a period you did NOT use when choosing your settings, for example, if you picked your RSI period by looking at Q1 data, test on Q3 data from a different year
- Run the test and compare how the indicator behaves on the out-of-sample data versus the data you optimized on
If the indicator’s signals degrade significantly on the out-of-sample period, you have a curve-fitted setting. If it performs comparably, you have a more robust setting.
A practical rule that most experienced traders apply: a setting should work reasonably well on at least three different instruments and two different time periods before you commit to it. A MACD setting that works on EUR/USD but fails on GBP/JPY and gold is not a strong setting, it is a coincidence.
The Strategy Tester’s optimization function (the “Optimization” checkbox) is specifically designed to find the best historical settings across a range of inputs. Beginners who use this feature and then trade the “winning” settings are almost always trading a curve-fitted result. Use the Strategy Tester to validate settings you chose independently, not to discover settings automatically.
A 30-Trade Rule for Beginners
Before changing any indicator setting from its default, complete 30 practice trades on a demo account using the default. Document each trade: what the indicator showed, what you did, and what happened. After 30 trades, you will have a concrete record of where the default setting served you and where it did not. Any adjustment you make after that process is grounded in your actual trading behavior, not in how a chart looks in hindsight.
This is the difference between adjusting a setting because you understand why it is failing and adjusting it because the chart looks cleaner. The first is strategy development. The second is curve fitting in disguise.
Best MT5 Indicators for Scalping
Scalping demands indicators that react quickly to short-term price changes without flooding the chart with noise. The best MT5 indicators for scalping prioritize speed over smoothness.
| Indicator | Recommended Setting | Best For | Limitation |
|---|---|---|---|
| EMA | 9 and 21 period | Trend direction on 1M-5M charts | Whipsaws in low-volume sessions |
| RSI | Period 7, levels 60/40 | Momentum confirmation | Frequent signals require discipline |
| Bollinger Bands | Period 10, deviation 1.5 | Breakout entries | Wider spread risk on fast moves |
| MACD | 5, 13, 1 | Momentum shifts | Lag still present even on fast settings |
For scalping on MT5, the 9/21 EMA combination on a 1-minute or 5-minute chart is a clean starting point. Pair it with a fast RSI (period 7) to filter momentum direction. Avoid adding more than two indicators to a scalping chart: the signals need to be immediate and unambiguous.
As documented in Investopedia’s guide to scalping strategies, scalping requires tighter risk management parameters because the smaller profit targets per trade demand a higher win rate to remain profitable.
Simple Trading Strategies for MT5 Using Indicators
Simple trading strategies for MT5 do not need to be complicated to be effective. Here are three rules-based setups beginners can practice on a demo account immediately.
Strategy 1: EMA Crossover with RSI Filter
- Timeframe: 15-minute or 1-hour chart
- Buy when: 20 EMA crosses above 50 EMA AND RSI is above 50 (not yet overbought)
- Sell when: 20 EMA crosses below 50 EMA AND RSI is below 50
- Stop loss: Below the most recent fractal low
Strategy 2: Bollinger Band Squeeze Breakout
- Timeframe: 4-hour chart
- Wait for: Bollinger Bands to narrow significantly (squeeze condition)
- Enter when: Price breaks and closes outside the band with increased volume
- Confirm with: MACD histogram expanding in the breakout direction
Strategy 3: RSI Divergence Reversal
- Timeframe: 1-hour chart
- Look for: Price making a new high while RSI makes a lower high (bearish divergence)
- Enter: Short position when price pulls back below the prior swing high
- Stop loss: Above the most recent price high
Each of these strategies uses a maximum of two indicators. That is intentional. The goal for any beginner is to understand the logic behind each signal, not to build the most complex system possible.
Two Things Most Beginners Get Wrong With MT5 Indicators
Most beginner guides on mt5 trading indicators stop at definitions and basic how-to steps. This section covers the two mistakes that actually cost traders money, and that almost no introductory resource addresses with enough specificity to be useful. These are not abstract warnings. They are concrete failure patterns with concrete fixes.
Mistake 1: Misunderstanding Indicator Lag, and the Psychological Spiral It Creates
Every lagging indicator, by definition, tells you what already happened. Moving Averages, MACD, and Bollinger Bands all process historical price data before generating a signal. This is not a flaw, it is a deliberate trade-off: you accept a later entry in exchange for higher confirmation confidence. The problem is not the lag itself. The problem is what lag does to beginner psychology.
The pattern plays out like this:
- A beginner adds a Moving Average crossover to their chart. They wait for the 20 EMA to cross the 50 EMA.
- The crossover fires. By the time it does, price has already moved 30-50 pips in the new direction on a 1-hour chart.
- The beginner enters. Price pulls back naturally, as it almost always does after a strong move, and hits their stop loss.
- Price then continues in the original direction, eventually reaching the target the beginner had identified.
- The beginner concludes the indicator "doesn’t work" and adds another indicator to get earlier confirmation.
This is the lag spiral. Each new indicator added to solve the lag problem is itself a lagging indicator, which means the combined signal fires even later. By the time four lagging indicators align, the move is largely over.
The mechanism behind the pullback: After a strong directional move, institutional participants and algorithmic systems frequently take partial profits, which creates a retracement. This retracement is normal market behavior. It is not a signal that the trend has reversed. Beginners who set stops at technically correct levels, just below the prior swing low, for example, often get stopped out during this retracement before price resumes.
The fix has two parts:
Part 1, Accept the lag as the cost of confirmation, and price it into your stop placement. If you know you are entering after a lagging signal, your entry is later in the move. That means the natural pullback is more likely to reach your stop if you place it at the "textbook" location. Widen your stop slightly to account for the retracement range, and reduce your position size proportionally to keep your risk per trade constant. A wider stop with a smaller position is not worse risk management, it is more honest risk management.
Part 2, Use one leading indicator to time entry within a trend confirmed by a lagging indicator. The RSI is the most practical tool for this. Once your lagging indicator (EMA crossover, MACD signal line cross) confirms the trend direction, wait for the RSI to pull back below 50 on a bullish setup before entering. This gives you a later confirmation but an earlier entry within the confirmed trend, reducing the distance to your stop and improving your risk-to-reward ratio.
A practical way to visualize this: think of your lagging indicator as answering “which direction is the market moving?” and your leading indicator as answering “is this a good moment within that direction to enter?” Running both questions simultaneously is more work than watching a single crossover, but it eliminates the majority of late-entry stops.
On the psychology side: The frustration of false signals and late entries is one of the primary reasons beginners abandon technically sound strategies too early. If you have documented 30 demo trades and your strategy has a positive expectancy, meaning the average winning trade is larger than the average losing trade even at a win rate below 50%, the strategy is not broken. The lag is working as designed. Switching strategies at this point resets your learning curve without solving the underlying problem.
Mistake 2: The MT5 Mobile App Indicator Gap (What Most Guides Never Tell You)
This is the most practically important warning in this entire guide for any beginner who plans to trade on a phone or tablet, and it is almost never mentioned in introductory MT5 content.
The core issue: The MT5 mobile app, available on iOS and Android, does not support custom indicators built for the desktop platform. MQL5 custom indicators are compiled as .ex5 files that run inside the desktop MetaTrader 5 environment. The mobile app has its own rendering engine and does not execute MQL5 code. This means:
- Any custom indicator you install on your desktop will not appear on your mobile charts
- Multi-timeframe indicators that pull data from higher timeframes will not render on mobile
- Alert-based custom indicators will not fire on mobile
- Visual tools like custom dashboard overlays, which many beginners download from MQL5.com, are desktop-only
What does work on MT5 mobile:
The built-in indicator library is available on mobile, but with limitations. The following built-in indicators render reliably on the MT5 iOS and Android apps:
| Indicator | Mobile Reliability | Notes |
|---|---|---|
| Moving Average (SMA/EMA) | High | All standard settings work |
| RSI | High | Standard 14-period renders correctly |
| MACD | High | Histogram and signal line display correctly |
| Bollinger Bands | High | Standard 20/2.0 settings work |
| Fractals | Medium | Visible but difficult to read on small screens |
| CCI | Medium | Renders correctly; threshold lines may be hard to see |
| Ichimoku | Low | Cloud components are difficult to read on mobile screens |
The practical workflow for beginners who use both desktop and mobile:
Use desktop MT5 for analysis, strategy setup, and indicator configuration. Use mobile MT5 for monitoring open positions and managing trades already in progress. Do not enter new trades from mobile based on indicator signals unless you have verified the same signal on desktop first. The risk is not that mobile charts are wrong, the built-in indicators calculate correctly, it is that the visual context is compressed enough that misreading a signal is significantly more likely on a small screen.
If you must trade from mobile only:
Limit yourself to two indicators maximum: a Moving Average (20 EMA) for trend direction and RSI (14) for momentum confirmation. These two render clearly on mobile, their signals are unambiguous, and they do not require the visual precision that multi-indicator setups demand. Accept that you are trading with less information than a desktop setup provides, and size your positions accordingly.
Some third-party brokers offer MT5 web platforms that run in a browser. These also have indicator limitations compared to the desktop app, custom indicators are not supported, and some built-in indicators behave differently depending on the browser and connection speed. If you are using a web-based MT5 interface, treat it the same way you would treat the mobile app: built-in indicators only, and verify signals on desktop before acting.
Why this matters for risk management: A beginner who builds a strategy around a custom multi-timeframe RSI indicator on desktop, then tries to monitor and manage that strategy on mobile, is operating with an information gap they may not even be aware of. The mobile chart will show price moving, but none of the custom indicator signals that informed the original trade setup will be visible. This is not a minor inconvenience, it is a structural blind spot that can lead to holding losing positions longer than the strategy intended, or exiting winning positions early because the mobile chart looks ambiguous without the full indicator context.
Custom Indicators vs. Built-In MT5 Tools: Which Should Beginners Use?
Start with built-in tools. Full stop.
Built-in MT5 indicators are documented, tested, and consistent across all versions of the platform. They are what educational resources, strategy guides, and communities reference. Learning on custom indicators first means you are learning in isolation: fewer tutorials, fewer community discussions, and no baseline to compare your results against.
Custom indicators become valuable once you have a clear gap that built-in tools cannot fill. Common examples include:
- Multi-timeframe indicators: Display the RSI or Moving Average from a higher timeframe directly on your current chart
- Alert-based tools: Fire notifications when specific conditions are met, so you do not need to watch charts constantly
- Volume profile indicators: MT5’s built-in volume data is tick-based; custom volume profile tools provide more nuanced market structure analysis
The MQL5 community marketplace hosts both free and paid custom indicators, with user ratings and backtesting data. When evaluating a custom indicator, check how recently it was updated and whether the developer responds to user questions. An abandoned indicator with no recent updates is a risk on newer MT5 builds.
EZMT5 takes a different approach entirely: rather than asking beginners to evaluate individual custom indicators, the platform provides 11 fully built and optimized MT5 trading systems with instant access after download. Each system is pre-configured with professional-grade indicator combinations, removing the guesswork of which tools to stack and how to set them up.
Custom indicators are worth exploring once you understand what you need them to do. Beginners who jump to custom tools before mastering built-ins often end up with complex setups they cannot diagnose when signals fail.
Conclusion: Build Your MT5 Indicator Stack the Right Way
The biggest challenge for new traders is not finding indicators: it is knowing which ones to trust, how to configure them without over-optimizing, and how to combine them without creating conflicting signals. That process takes time, practice, and a clear framework. EZMT5 shortens that curve significantly with instant access to 11 professional MT5 trading systems, two license keys per system that can be changed at any time, and a no-contract monthly subscription that lets you start trading like a professional immediately after download. Get started with EZMT5 and trade with the precision that most beginners spend months trying to build on their own.
Frequently Asked Questions
What are the best MT5 indicators for beginners?
The best MT5 trading indicators for beginners are Moving Averages (SMA and EMA), RSI, MACD, and Bollinger Bands. These built-in tools cover trend following, momentum, and volatility, the three core pillars of technical analysis. Start with just one or two indicators rather than cluttering your chart. For example, pairing a 50-period EMA with RSI gives you both trend direction and overbought/oversold signals without overwhelming complexity.
How do I add indicators to MetaTrader 5?
To add a built-in indicator on MT5, open a chart, click 'Insert' in the top menu, then select 'Indicators' and choose your preferred tool. For custom indicators, download the .ex5 or .mq5 file, then go to File > Open Data Folder > MQL5 > Indicators, paste the file there, restart MT5, and the indicator will appear in your Navigator panel under 'Indicators'. This process works on both demo and live accounts.
How many indicators should a beginner use on MT5?
Beginners should use no more than two or three MT5 trading indicators at once. Using too many creates conflicting buy and sell signals and leads to analysis paralysis, a common mistake called 'indicator clutter.' A practical starting stack for MT5 might be one trend indicator like an EMA, one momentum indicator like RSI, and one volatility tool like Bollinger Bands. Less is almost always more when you're learning to read price action.
Are custom indicators better than built-in MT5 indicators?
Not necessarily. Built-in MT5 indicators like MACD, RSI, and Moving Averages are reliable, well-tested, and sufficient for most beginner strategies. Custom indicators built via MQL5 can offer advanced signals and automation through Expert Advisors, but they vary widely in quality. A poorly coded custom indicator can give false signals. Beginners should master the built-in tools first before exploring the MQL5 marketplace or third-party custom indicators.
Can MT5 indicators predict market direction accurately?
No indicator can predict market direction with certainty. MT5 trading indicators are mathematical tools based on historical price data, which means they are inherently lagging in nature. They help identify probable entry points and exit points and improve risk management decisions, but they do not guarantee outcomes. This is especially true in volatile Forex trading or CFDs with leverage. Use indicators as a decision-support tool, not a crystal ball, and always combine them with sound risk management.
What are the best MT5 indicators for scalping?
The best MT5 indicators for scalping are fast-reacting tools: the EMA (set to 9 or 21 periods), RSI on a short timeframe like M1 or M5, and the MACD with tightened settings. Bollinger Bands are also popular for scalping because they highlight short-term volatility squeezes. When using these for scalping strategies, reduce the default indicator settings to react faster to price action, but be aware that tighter settings also produce more false signals.
This article was written using GrandRanker