
Table of Contents
- What Are MT5 Charting Tools Explained
- MT5 Timeframes Explained and Periodicity Options
- MT5 Technical Indicators List and Oscillators
- How to Use MT5 Drawing Tools for Price Action
- MT5 Chart Templates Tutorial and Customization
- Advanced Charting: Multi-Monitor Setup and Automation
- Troubleshooting MT5 Charting Issues and Data Errors
- MT5 vs MT4: Key Charting Differences and Advantages
Last Updated: July 1, 2026
What Are MT5 Charting Tools Explained
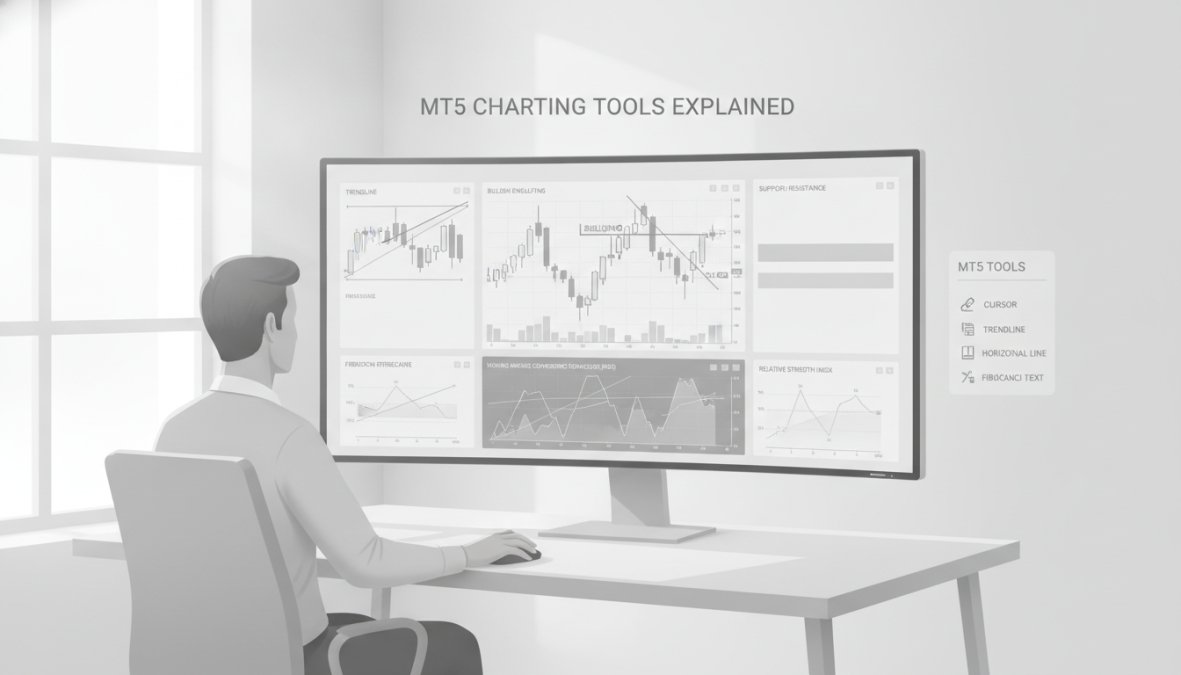
MetaTrader 5 charting tools transform raw market data into actionable visual information for technical analysis. The platform displays real-time data, historical price movements, and custom indicators within a single professional-grade interface. MT5 supports over 80 built-in technical indicators and oscillators, making it one of the most comprehensive charting systems available.
The core components include candlestick patterns that reveal market psychology, support and resistance levels that define price boundaries, and oscillators that measure momentum shifts. What separates effective charting from amateur attempts is knowing which tools to use and when to use them.
The biggest mistake traders make is using too many indicators simultaneously. A single well-chosen indicator beats five poorly-combined ones every time. Start with price action and one oscillator, then add complexity only when you’ve mastered the basics.
MT5 Timeframes Explained and Periodicity Options
Selecting the right timeframe determines whether your analysis matches your trading strategy. Each timeframe represents a different perspective on the same market data, from ultra-short-term scalping to long-term position trading.
MT5 offers 21 timeframe options ranging from 1-minute to monthly charts. The most commonly used are M5 (5-minute), M15 (15-minute), H1 (hourly), H4 (4-hour), D1 (daily), and W1 (weekly). A 1-minute chart shows every tick of price movement, while a weekly chart smooths daily volatility to reveal structural trends.
Timeframe selection should match your available trading time, not your preferred style. If you can only monitor charts for 30 minutes daily, a daily timeframe makes sense even if you prefer faster trading. Trying to day trade on a 1-minute chart while working full-time guarantees missed signals and poor execution.
Selecting the Right Timeframe for Your Strategy
The ideal timeframe depends on three factors: your available time to monitor positions, your risk tolerance per trade, and your market outlook timeframe. Many professional traders use multiple timeframes simultaneously, analyzing the daily chart for trend direction, the 4-hour chart for entry signals, and the 1-hour chart for precise timing. This hierarchical approach reduces false signals by trading with the trend, not against it.
The timeframe you choose determines the patterns you see and the opportunities you find. A perfect buy signal on the 4-hour timeframe might look completely different on the 1-hour timeframe.
MT5 Technical Indicators List and Oscillators
Technical indicators transform raw price data into mathematical relationships that reveal market conditions. The most essential indicators fall into three categories: trend indicators (moving averages, MACD), momentum oscillators (RSI, Stochastic), and volatility measures (Bollinger Bands, ATR).
Moving averages smooth price data to reveal underlying trends. The simple moving average (SMA) gives equal weight to all prices; the exponential moving average (EMA) weights recent prices more heavily. Traders use moving average crossovers as buy signals.
The Relative Strength Index (RSI) measures momentum on a 0-100 scale. Values above 70 indicate overbought conditions; values below 30 indicate oversold conditions. However, RSI can remain overbought or oversold during strong trends, making it unreliable as a standalone signal.
The MACD combines moving averages to show momentum and trend changes. When the MACD line crosses above the signal line, it generates a bullish signal. Bollinger Bands measure volatility by plotting standard deviations above and below a moving average, indicating when price may revert toward the middle.
Installing Custom Indicators for Advanced Analysis
Custom indicators from the MQL5 marketplace allow you to create indicators tailored to specific strategies. To install a custom indicator, download the .mq5 file and place it in the Indicators folder within your MetaTrader 5 directory (typically C:UsersYourUsernameAppDataRoamingMetaQuotesTerminal[Your Broker ID]MQL5Indicators). Restart MetaTrader 5 or right-click the Indicators folder and select "Refresh." The new indicator appears in the Navigator panel under Custom Indicators.
Install custom indicators one at a time and test them thoroughly on historical data before using them on live trades.
Custom indicators from unknown sources can contain malware. Only download from verified sources like the official MQL5 marketplace or reputable broker platforms.
How to Use MT5 Drawing Tools for Price Action
Drawing tools transform charts into interactive analysis canvases. The most essential tools are the line (for trendlines), horizontal line (for support and resistance), rectangle (for price ranges), and text (for annotations).
Drawing a trendline connects two or more price points to show trend direction. An uptrend line connects rising lows; a downtrend line connects falling highs. When price breaks through a trendline with conviction, it often signals a trend reversal.
Support and resistance levels define where price tends to stop and reverse. Drawing horizontal lines at these key levels creates a visual reference for faster decision-making when price approaches them.
Trendlines, Fibonacci Retracement, and Graphical Objects
The Fibonacci retracement tool divides the distance between two price points into levels based on the Fibonacci sequence: 23.6%, 38.2%, 50%, 61.8%, and 78.6%. These levels often act as support and resistance during corrections. To apply Fibonacci retracement, click the tool, then click the starting point (usually a significant low) and drag to the ending point (usually a significant high).
Graphical objects include rectangles, circles, triangles, and custom shapes. Traders use rectangles to mark consolidation ranges, circles to highlight significant price levels, and text boxes to add annotations.
Keyboard Shortcuts for Faster Chart Annotation
Keyboard shortcuts dramatically speed up chart annotation. Common MT5 shortcuts include:
- Ctrl+L for line tool
- Ctrl+H for horizontal line
- Ctrl+R for rectangle
- Ctrl+T for text
- Ctrl+F for Fibonacci retracement
- Delete key to remove selected object
Navigation shortcuts include:
- Ctrl+Left Arrow to move chart left
- Ctrl+Right Arrow to move chart right
- Ctrl+Up Arrow to zoom in
- Ctrl+Down Arrow to zoom out
Mastering these shortcuts separates traders who annotate quickly from those who waste time navigating menus.
MT5 Chart Templates Tutorial and Customization
Chart templates save your preferred settings and apply them instantly to any new chart. Creating a template starts with setting up a single chart exactly as you want it. Add your preferred indicators, set colors, adjust timeframe, and arrange drawing tools. Then go to File > Templates > Save Template and give it a descriptive name like "Swing Trading Setup."
The next time you want to apply this setup to a different currency pair, right-click the chart and select Template > Apply Template > [Your Template Name]. Every setting applies instantly.
Professional traders often maintain 3-5 different templates for different trading styles. A scalping template might include 5-minute and 15-minute charts with momentum oscillators. A swing trading template might include 4-hour and daily charts with trend indicators.
Save different templates for different market conditions. A “High Volatility” template might use wider Bollinger Bands and different indicator settings than a “Low Volatility” template.
Advanced Charting: Multi-Monitor Setup and Automation
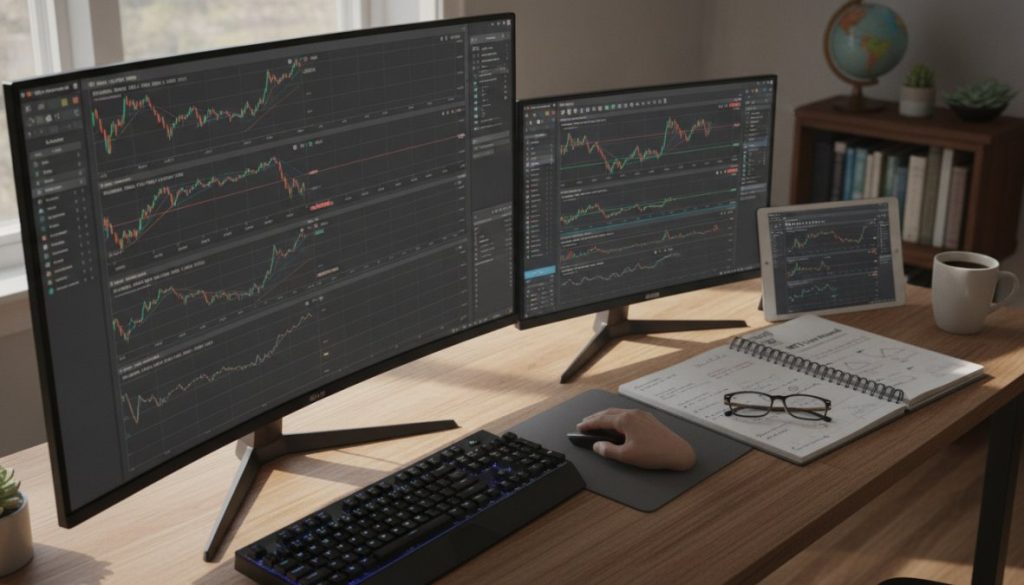
Professional traders rarely work with a single monitor. Multiple monitors let you monitor different timeframes, different currency pairs, and different asset classes simultaneously.
A typical multi-monitor setup for active traders includes 3-4 monitors. Position the primary monitor directly in front of you at eye level to avoid neck strain. Arrange secondary monitors for supporting information and monitoring, not primary analysis.
MetaTrader 5 handles multiple monitors seamlessly. You can drag chart windows to different monitors, arrange them side-by-side, or tile them in grids. The platform remembers your layout and restores it when you restart.
Using Expert Advisors and Automated Trading with Charts
Expert Advisors (EAs) are automated trading robots that execute trades based on programmed logic. They read the same chart data you analyze manually but execute trades instantly without emotion. The real power emerges when EAs work alongside your manual chart analysis, you identify high-probability setups using charting skills, then the EA handles entry timing and position management with mechanical precision.
Installing an EA requires placing the .ex5 file in the Experts folder and restarting the platform. Once installed, drag the EA from the Navigator panel onto the chart. The EA then reads price data and executes trades according to its programming.
Troubleshooting MT5 Charting Issues and Data Errors
Missing historical data is the most common problem. This happens when your broker doesn’t provide extended historical data or when MetaTrader 5 hasn’t downloaded it yet. Check your broker’s data policy and request historical data through the platform’s History Center.
Real-time quote problems occur when the platform stops receiving live price updates. This usually indicates a connection issue between your computer and your broker’s servers. Restarting MetaTrader 5 or checking your internet connection typically resolves this.
Indicator calculation errors appear as obviously wrong values or flat lines. This happens when the indicator doesn’t have enough historical data to calculate properly. A 200-period moving average needs 200+ bars of data.
Fixing Missing Historical Data and Real-Time Quote Problems
To manually request historical data, right-click the chart and select "Refresh Rates" or go to Tools > History Center. This lets you download historical data for any timeframe and instrument your broker supports.
For persistent quote problems, check your broker’s server status page. If their servers are experiencing issues, contact their support team.
MT5 vs MT4: Key Charting Differences and Advantages
MT5 offers 21 timeframes compared to MT4’s 9 timeframes, providing more granular analysis options. The charting engine in MT5 handles large datasets more efficiently, you can load 10 years of tick data without the platform slowing down. MT4 struggles with extended historical data.
MT5’s drawing tools are more intuitive and offer more options. You can create custom shapes and adjust tool properties more easily. MT5 processes charts 40% faster than MT4 when working with large datasets.
The biggest advantage for active traders is MT5’s ability to run multiple Expert Advisors on a single chart simultaneously. MT4 allows only one EA per chart, forcing traders to use multiple charts if they want to run multiple strategies.
| Feature | MT4 | MT5 | Winner |
|---|---|---|---|
| Available Timeframes | 9 | 21 | MT5 |
| Multiple EAs Per Chart | No | Yes | MT5 |
| Historical Data Handling | Limited | Strong | MT5 |
| Drawing Tool Options | Basic | Advanced | MT5 |
| Indicator Complexity | Standard | Advanced | MT5 |
| Learning Curve | Easier | Steeper | MT4 |
The learning curve for MT5 is steeper than MT4, but traders who invest the time gain significant analytical advantages.
Mastering MT5 charting tools gives you the analytical foundation that separates consistent traders from those struggling with unclear signals. The platform provides every tool you need; the challenge is knowing which tools to use and when to use them. EZMT5 delivers fully built and optimized MT5 trading systems that integrate with your charting analysis, enabling you to automate high-probability setups while maintaining flexibility to adapt to changing market conditions. EZMT5 professional trading systems provide the automation layer that transforms your charting insights into consistent profits.
Frequently Asked Questions
What are the best MT5 charting tools for technical analysis?
MT5 charting tools include built-in indicators (moving averages, RSI, MACD), drawing tools (trendlines, Fibonacci retracement), and graphical objects for price action analysis. The best tools depend on your strategy, oscillators work well for overbought/oversold conditions, while trendlines excel at identifying support and resistance levels. Many traders combine multiple indicators with candlestick pattern recognition for comprehensive technical analysis across different timeframes.
How do I install custom indicators in MT5?
To install custom indicators in MT5, download the MQL5 indicator file (.mq5 or .ex5 format) and place it in your MT5 Navigator's Indicators folder (File > Open Data Folder > MQL5 > Indicators). Restart MT5 and the indicator appears in your Navigator. You can then drag it onto any chart. For advanced traders, custom indicators from MQL5 community extend your technical analysis capabilities beyond standard oscillators and moving averages.
Can I save and reuse chart templates in MT5?
Yes, MT5 allows you to save custom chart templates with all your preferred settings, indicators, timeframes, drawing tools, and visual preferences. Right-click your chart and select 'Save Chart Template,' name it, then apply it to other charts instantly. This is essential for traders managing multiple currency pairs, stocks, or CFD instruments. Saved templates ensure consistent technical analysis across your trading sessions.
What keyboard shortcuts improve MT5 charting efficiency?
Essential MT5 charting shortcuts include: Insert (add drawing tools), Delete (remove objects), Alt+D (open Drawing Tools panel), and Ctrl+T (toggle trendlines). These shortcuts accelerate your workflow when analyzing price action and placing graphical objects on charts. Power users combine keyboard shortcuts with multi-monitor setups to manage multiple timeframes and trading pairs simultaneously, improving both speed and accuracy in real-time market analysis.
This article was written using GrandRanker